Corporate Carbon Footprint
Most carbon accounting platforms stop at spend-based estimates. Carbon Maps traces emissions back to the farming practices, origins, and suppliers that drive them.
the challenge

For companies in the food industry, building a credible corporate carbon footprint means getting Scope 3 right.

01
Scope 3 is where your emissions actually live
For food companies, 80–90% of emissions sit in Scope 3 — primarily in purchased goods and agricultural supply chains. A CCF that relies on spend-based estimates for that category is directionally useful at best.
02
CSRD demands more than a number
Regulatory frameworks now require traceable, auditable emissions data at product and supplier level. A corporate footprint built on category averages won't hold up to external review.
03
Scope 3.1 is especially too complex for generic tools
Emissions from purchased agricultural goods vary dramatically by origin, farming practice, and processing method. Generic platforms model a commodity; Carbon Maps models your actual supply chain.
04
You can't decarbonise what you can't trace
Without connecting your corporate footprint to the products and suppliers that drive it, identifying where to act and proving progress remains guesswork.
A mockup of Carbon Maps platform showing the lifecycle of a strawberry yogurt, the composition, and the impact of the packaging, and the emissions per kilo or per unit of yogurt
The Carbon Maps Difference

Depth that generalist platforms can't match.

Scope 3.1 flows automatically from your product carbon footprints
No manual estimation or double entry — when your PCF data updates, your corporate footprint updates with it.
Aligned with the frameworks your stakeholders already require
Carbon Maps' methodology is aligned with GHG Protocol, SBTi FLAG, and CSRD — so your corporate footprint is ready for external reporting from day one.
Every modelling choice is fully traceable
Every emission factor, data source, and methodology decision is documented and auditable — so your results hold up to scrutiny from regulators, customers, and investors.
A mockup of Carbon Maps platform showing the lifecycle of a strawberry yogurt, the composition, and the impact of the packaging, and the emissions per kilo or per unit of yogurt
Corporate carbon footprint for food companies

One platform. Every emission. Traced to its source.

A mockup of Carbon Maps' platform featuring PEF indicators
Scope 1, 2, and 3 in one place
One dashboard across your entire organisation — connected to the products and suppliers that drive your emissions, not just category-level estimates.
A mockup of Carbon Maps' platform featuring PEF indicators
Trace every tonne back to its source
Carbon Maps connects your corporate footprint to the specific products, ingredients, and suppliers that drive it — so you know exactly where to act, and can prove it.
A mockup of Carbon Maps' platform featuring PEF indicators
Activity-based Scope 3
Our deep expertise in Product Carbon Footprinting means we model Scope 3 categories from activity data rather than spend proxies, giving you a more granular, defensible corporate footprint.
A mockup of Carbon Maps' platform featuring PEF indicators
Reports your stakeholders can trust
Every emission factor, data source, and modelling decision is fully traceable — generating framework-aligned outputs for CSRD, SBTi FLAG, and GHG Protocol on demand.
A mockup of Carbon Maps platform showing the lifecycle of a strawberry yogurt, the composition, and the impact of the packaging, and the emissions per kilo or per unit of yogurt

Frequently Asked Qusetions

Une vue d'ensemble de l'importance de mesurer vos émissions des Scopes 1, 2 et 3.

Que sont les Scopes 1, 2 et 3, et pourquoi est-il important de tous les mesurer pour une entreprise du secteur alimentaire ?

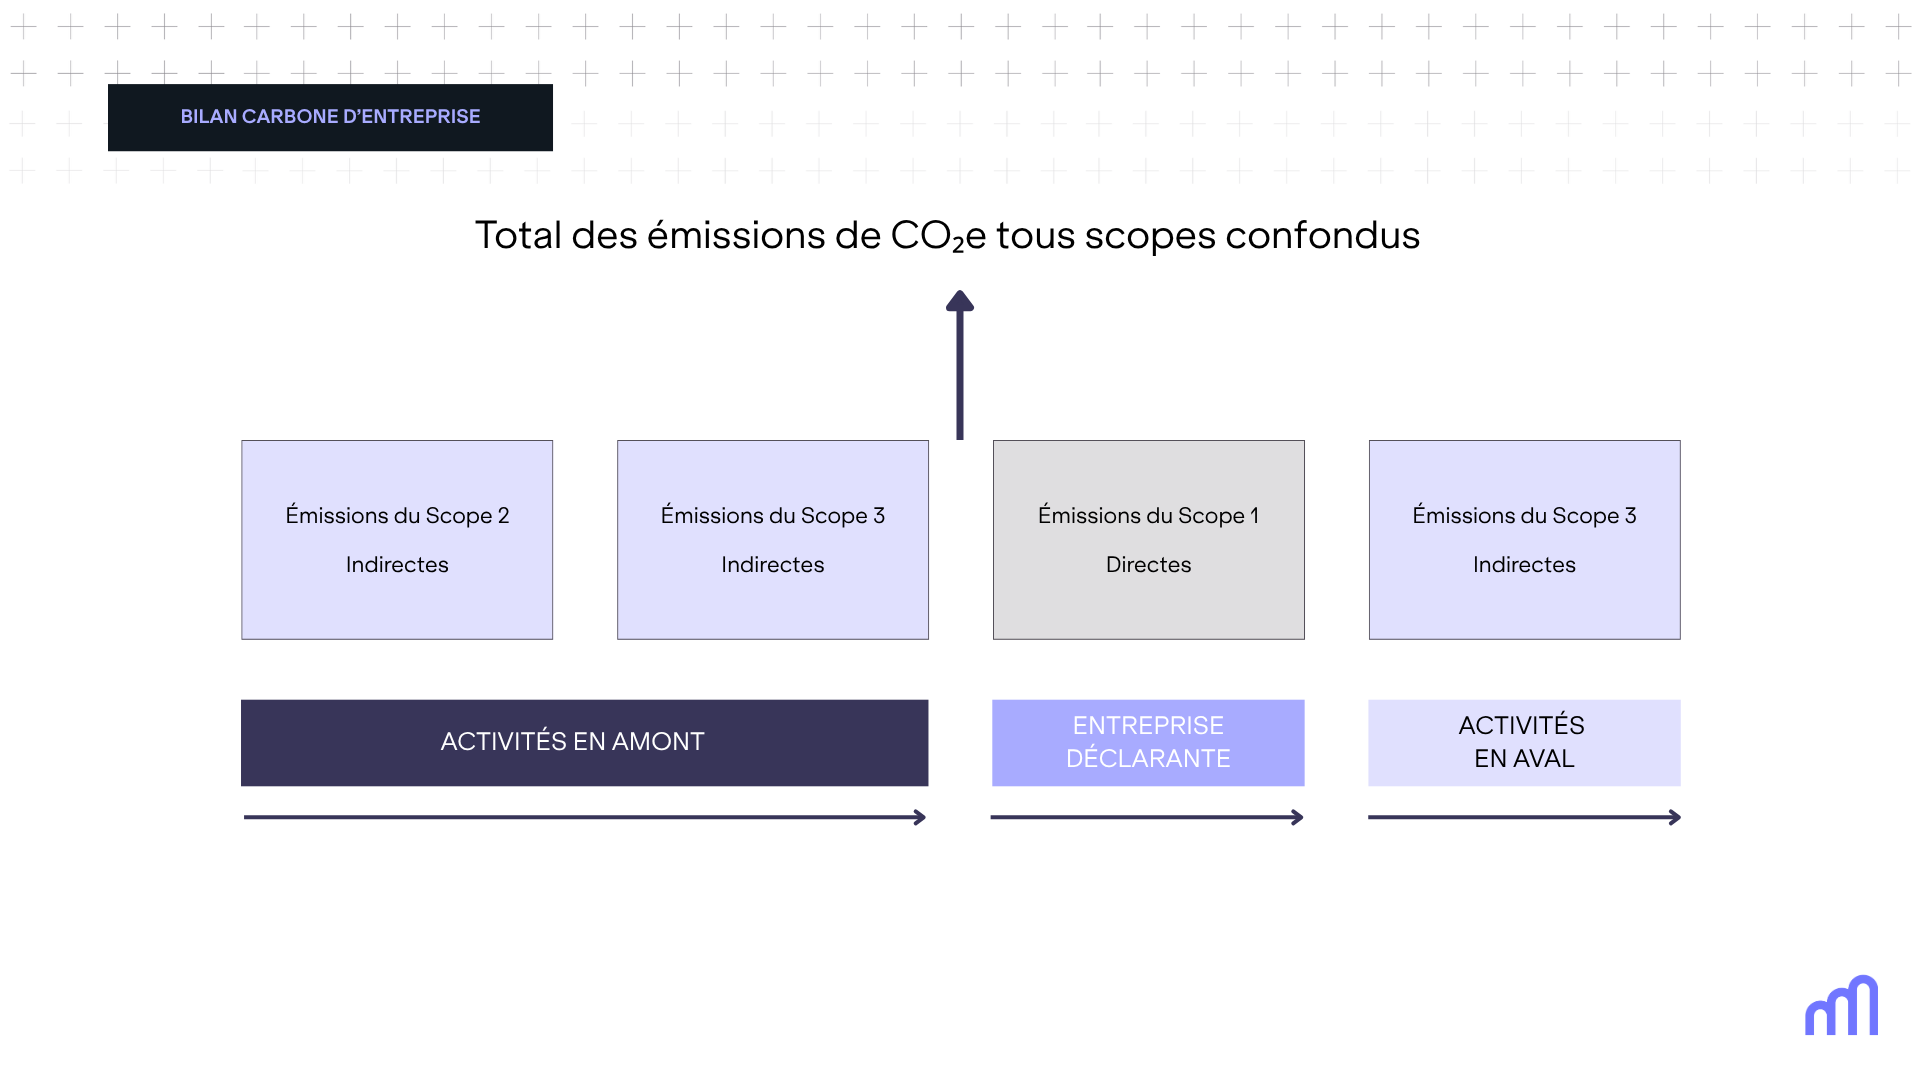
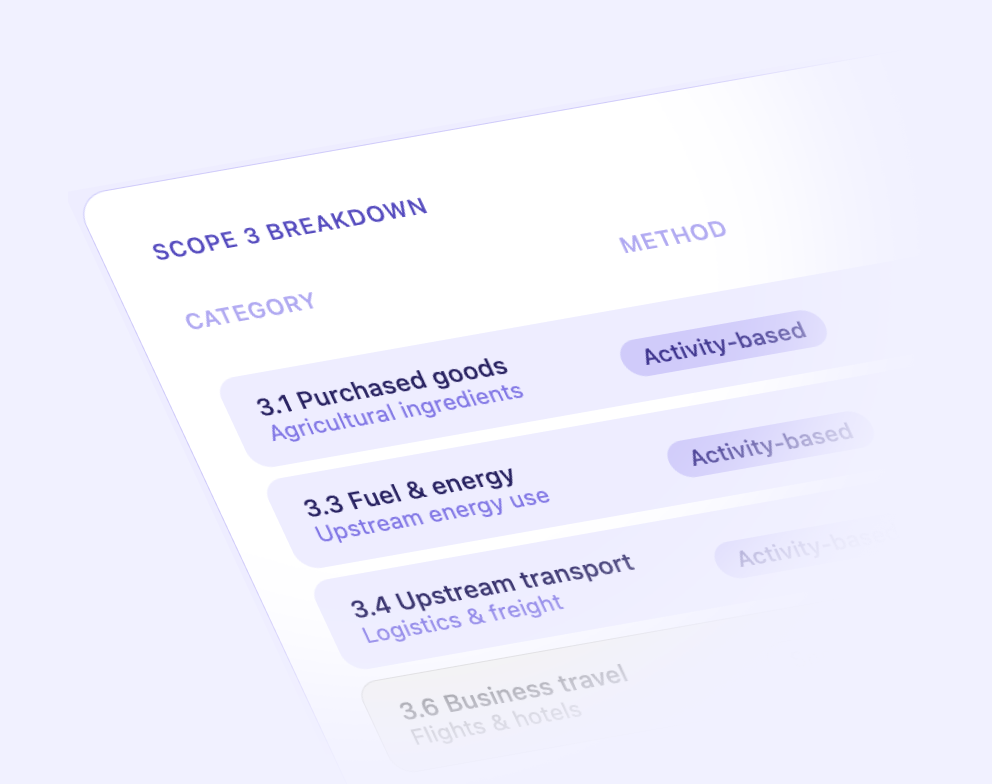
Les émissions du Scope 1 sont les émissions directes de vos propres opérations (ex. usines, véhicules). Les émissions du Scope 2 sont les émissions indirectes liées à l’électricité que vous achetez. Enfin, les émissions du Scope 3 sont toutes les autres émissions indirectes de votre chaîne de valeur (matières premières, transport, consommation, déchets). Pour les entreprises alimentaires, le Scope 3 est souvent la partie la plus importante du bilan.

Comment votre plateforme gère-t-elle la complexité de la chaîne d'approvisionnement d'une entreprise agroalimentaire ?

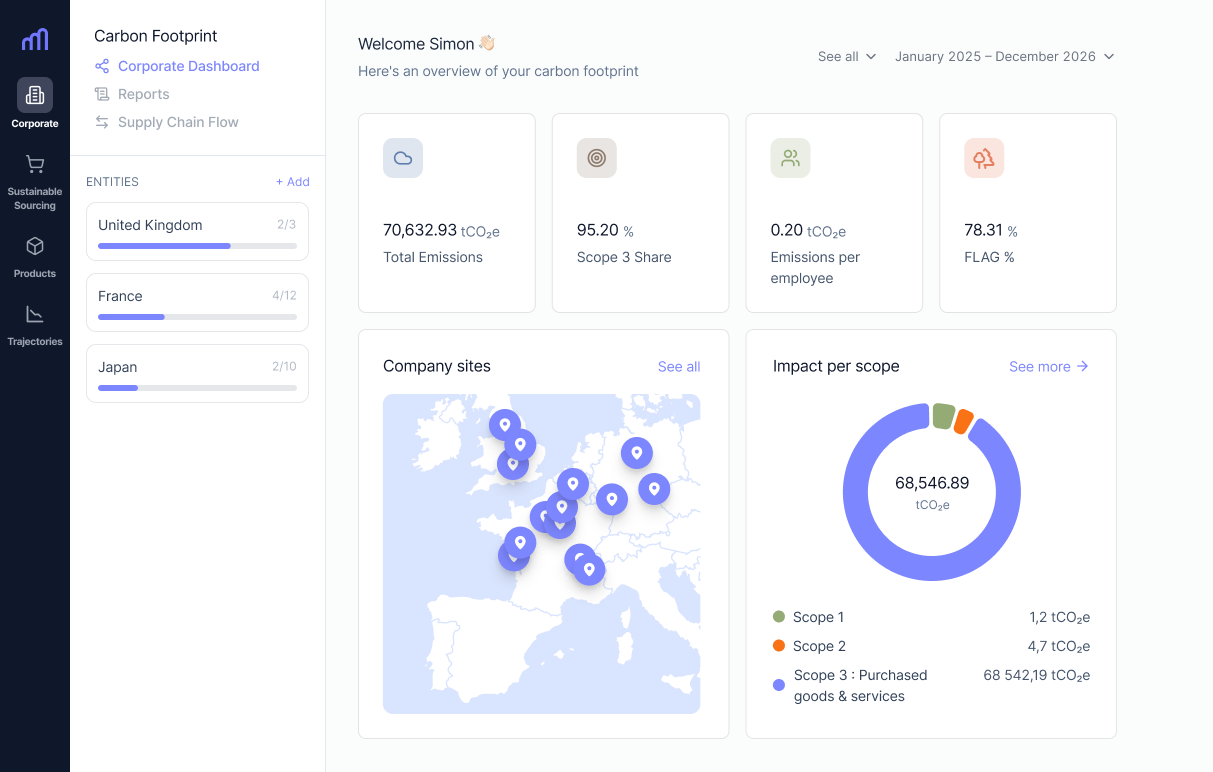
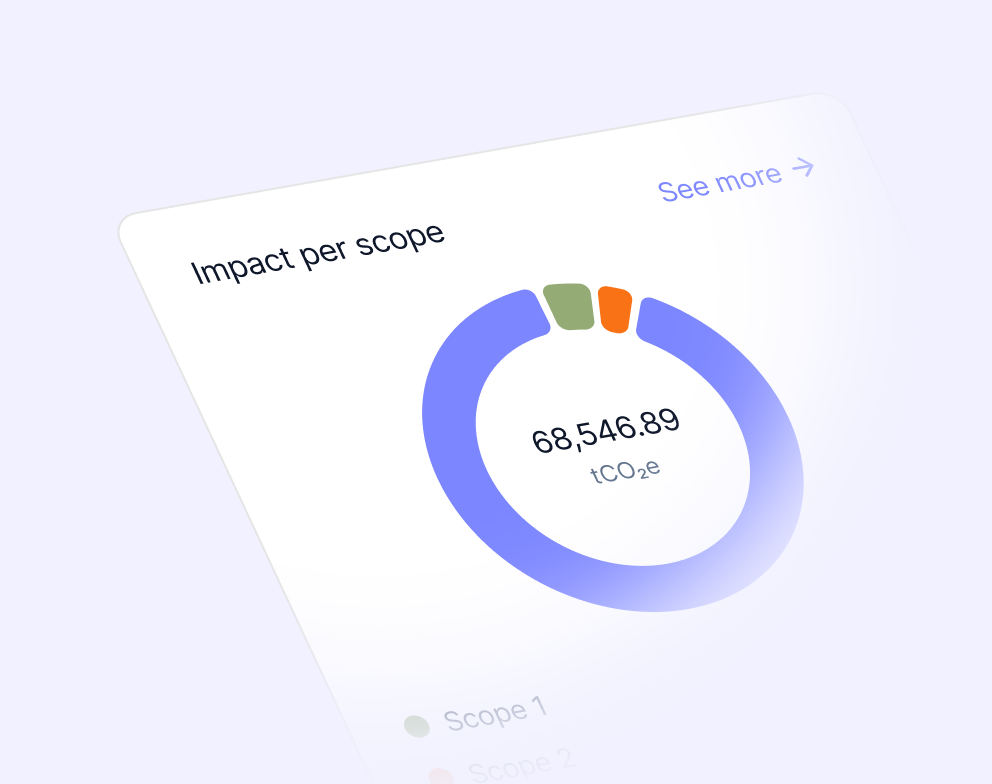
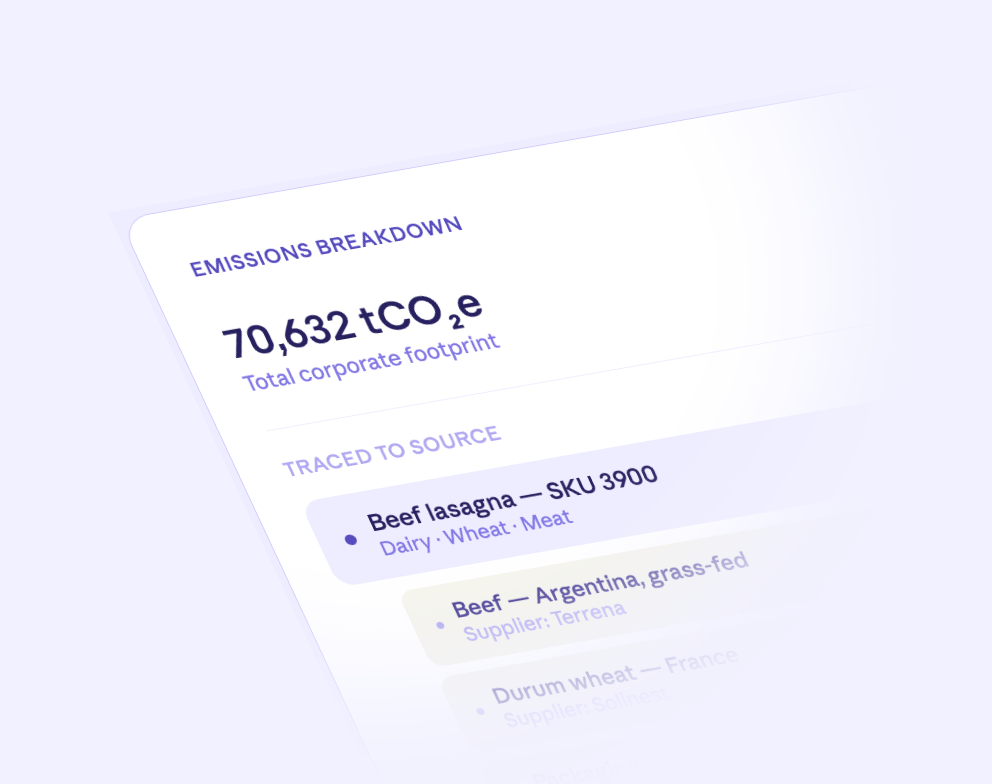
La plateforme Carbon Maps utilise l'ingestion automatisée pour collecter les données d'émissions de vos opérations et de vos fournisseurs. Nos outils intelligents valident et organisent ces données, vous donnant une vue granulaire et claire de vos émissions pour identifier les principales sources de réduction.

Puis-je utiliser ces données pour prendre des décisions opérationnelles ?

Oui. La plateforme Carbon Maps vous aide à identifier les émissions les plus élevées et vous permet de simuler l'impact de changements, comme l'utilisation d'un nouveau fournisseur. Cela transforme vos données carbone en informations exploitables pour des décisions opérationnelles plus éclairées.

Cela m'aide-t-il avec les rapports et la conformité ?

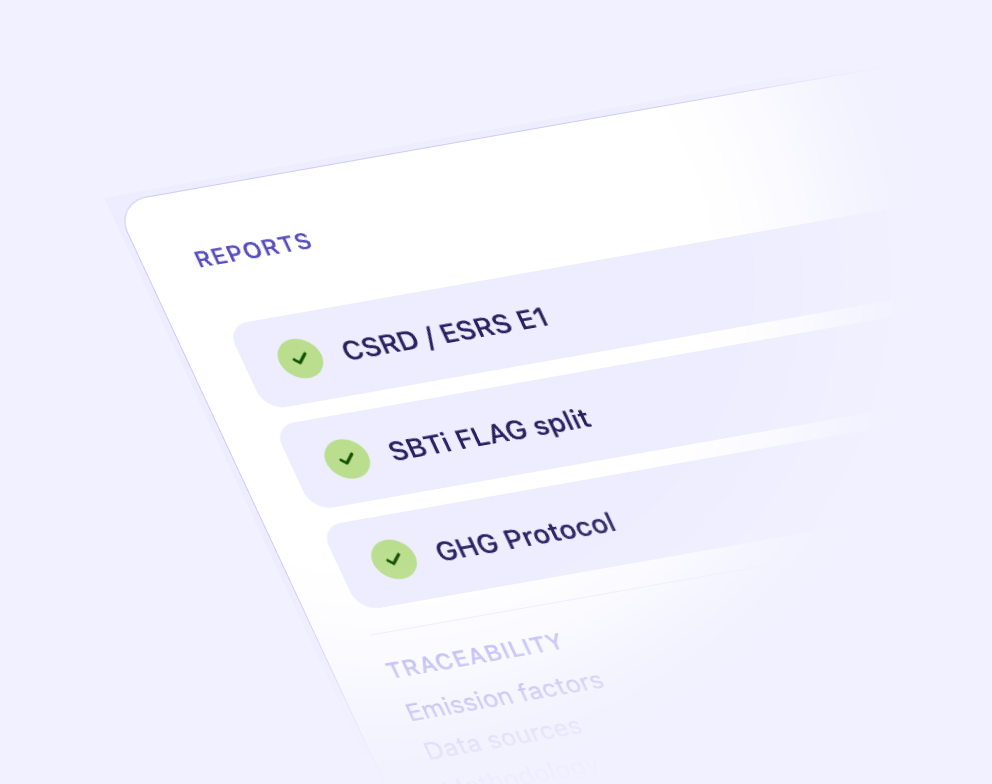
Tout à fait. Notre plateforme centralise vos données avec des pistes d'audit complètes, ce qui facilite la génération de rapports conformes aux normes internationales comme la CSRD, la SBTi et le CDP. Vous pouvez ainsi faire vos rapports en toute confiance et clarté.product carbon footprint (PCF) measures the emissions associated with a single product across its lifecycle, from raw ingredient to end consumer. A corporate carbon footprint aggregates emissions across an entire organisation. The two are closely linked: in Carbon Maps, Scope 3.1 (purchased goods and services) flows automatically from product-level data into the corporate footprint, eliminating manual estimation and ensuring consistency between the two.

How do SBTi FLAG targets affect carbon accounting for food companies?

SBTi's Forest, Land and Agriculture (FLAG) guidance requires food companies with significant land-based emissions to set separate reduction targets for their agricultural supply chain. This means Scope 3.1 emissions, particularly those from livestock, land use change, and crop production, need to be measured and reported with a FLAG split. Carbon Maps generates this split automatically, so food companies can set and track FLAG-aligned targets without additional manual calculation.

Ne mesurez pas juste pour cocher une case. Mesurez pour agir.

Contactez-nous pour transformer vos données carbone en actions concrètes.

Image du blog

Bilan Carbone Entreprise : Guide pour le Secteur Agroalimentaire

Image du blog

Émissions de Scope 3 : Guide complet des 15 catégories

Image du blog

Aborder les Scopes 1, 2 et 3 dans le Food Service