


Key questions on corporate carbon accounting for food companies.
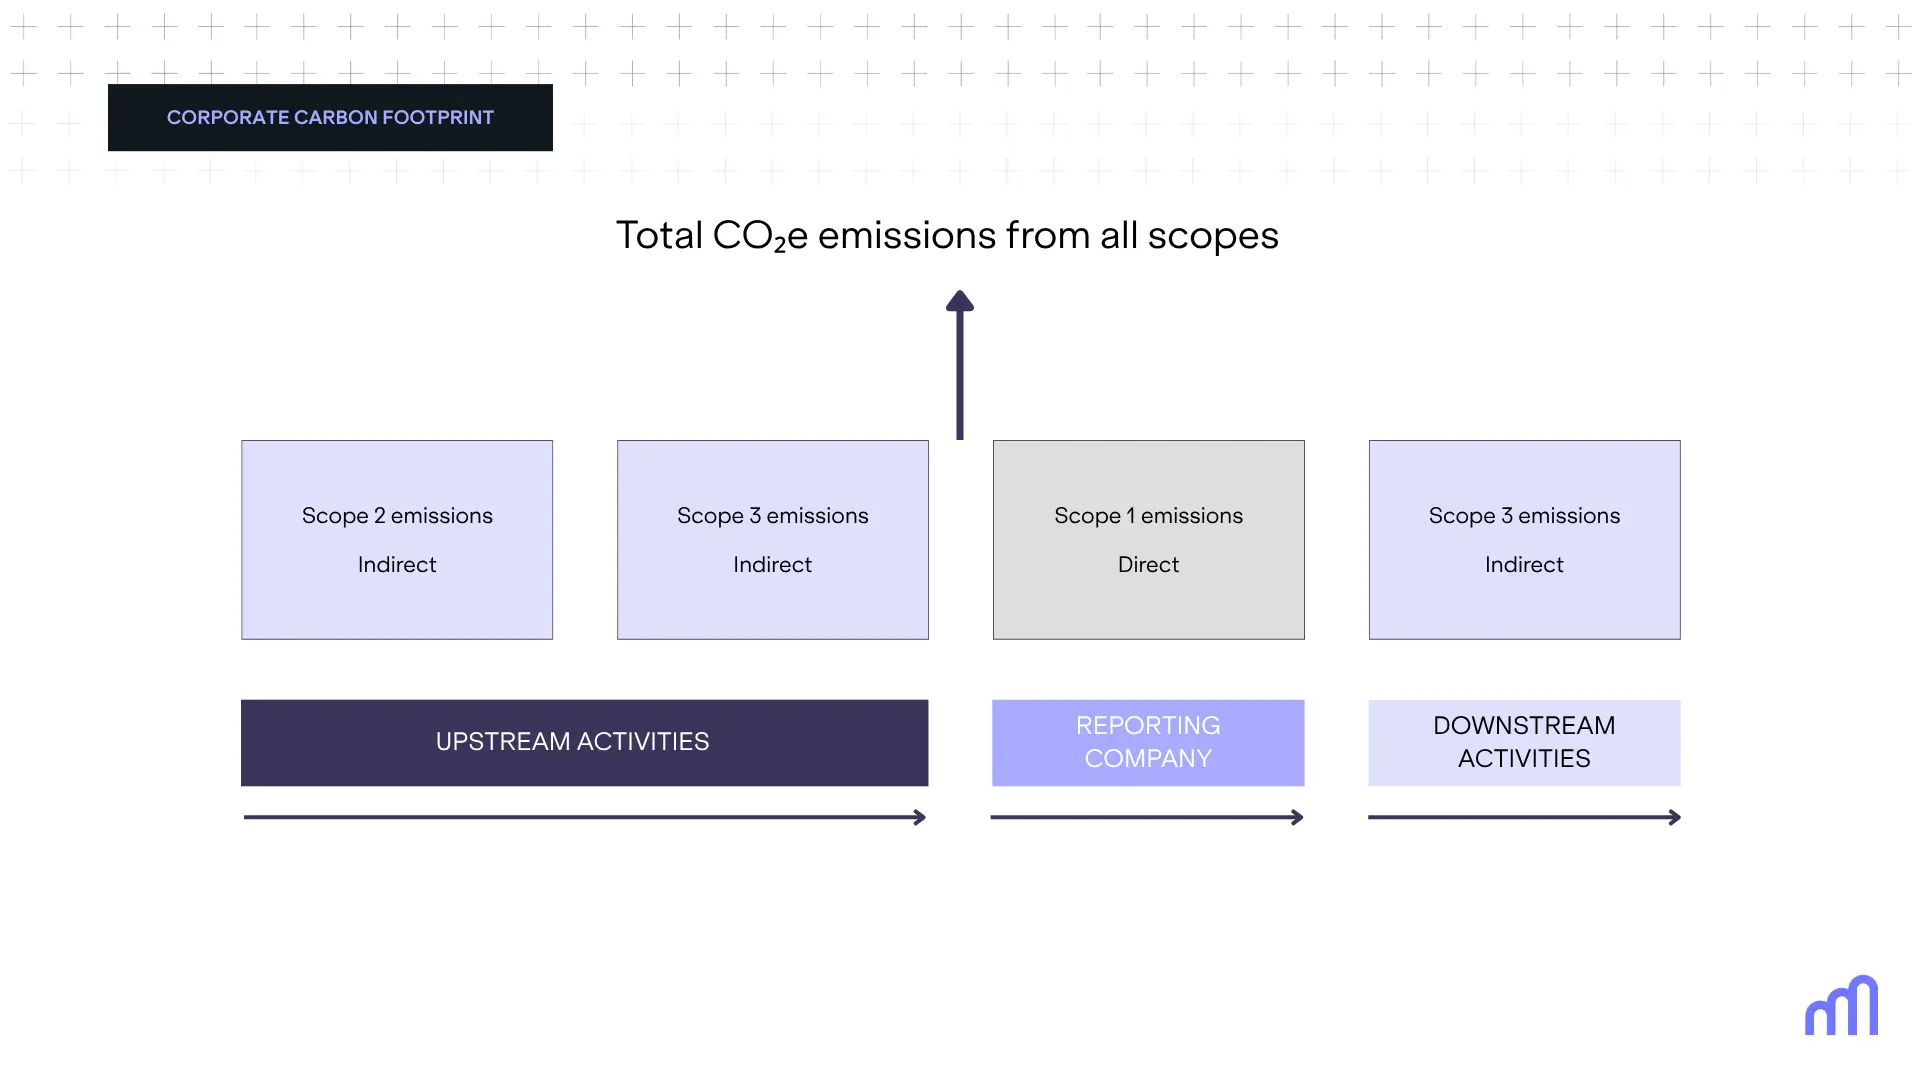
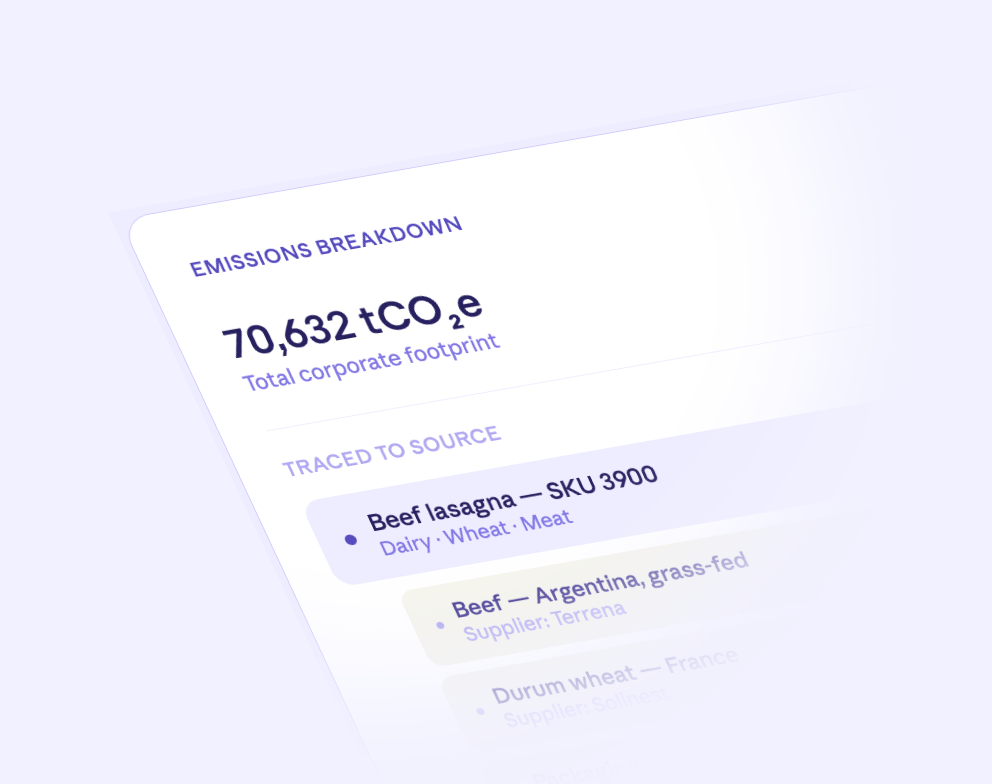
A corporate carbon footprint (CCF) measures the total greenhouse gas emissions generated by a company's operations and value chain, across Scope 1 (direct emissions), Scope 2 (purchased energy), and Scope 3 (indirect emissions from suppliers, ingredients, logistics, and product use). For food companies, Scope 3 typically accounts for 80-90% of total emissions, making it the most critical and complex category to measure.
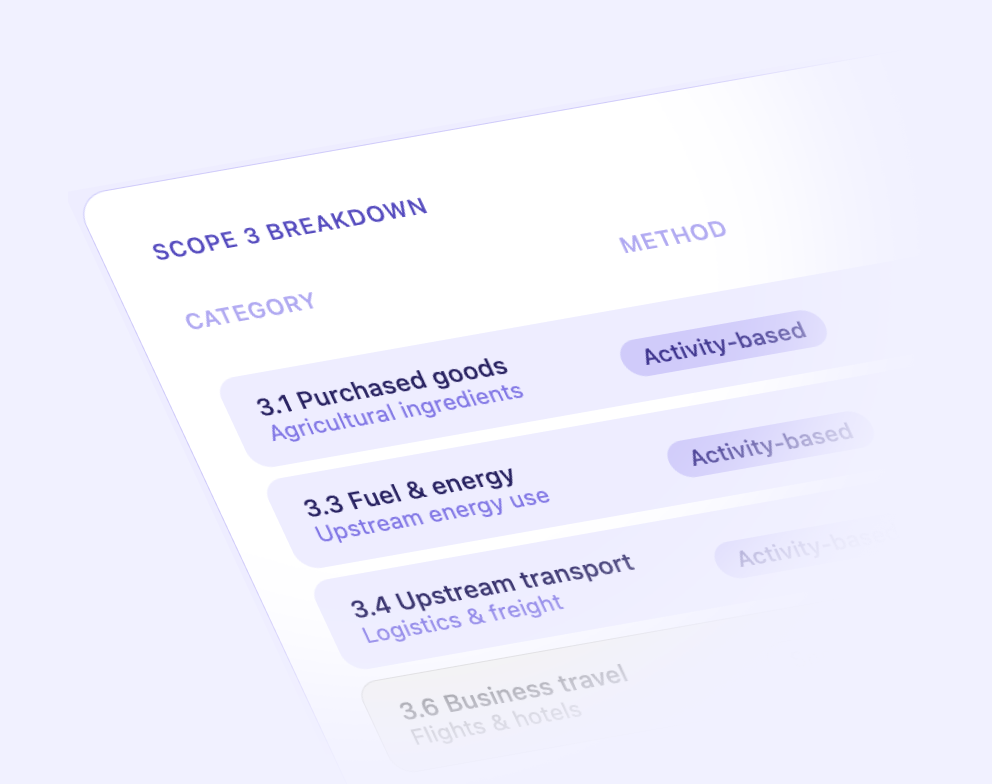
Unlike other industries, food supply chains involve agricultural raw materials whose emissions vary significantly depending on origin, farming practice, animal feed, land use change, and processing method. Spend-based estimation — the default approach for most generic carbon tools — cannot capture these differences. Accurate Scope 3 measurement in food requires activity-based modeling at ingredient level, which is what Carbon Maps is built to do.
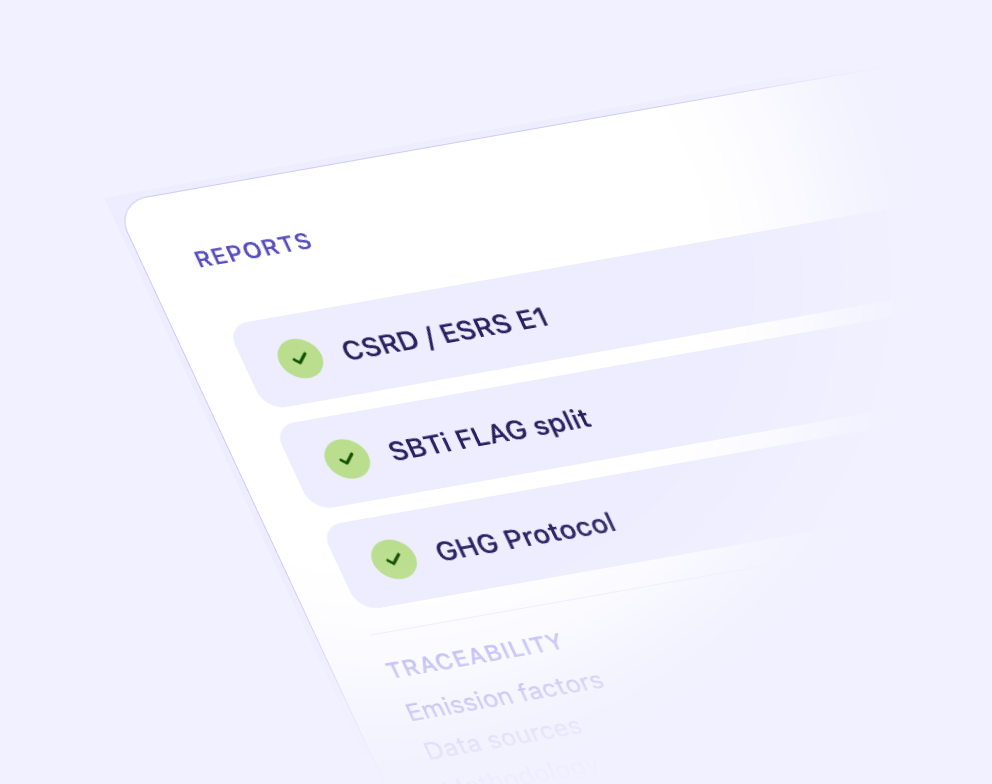
The Corporate Sustainability Reporting Directive (CSRD) requires large EU companies to disclose detailed Scope 1, 2, and 3 emissions data under the ESRS E1 standard, starting from FY2024 for the largest companies. For food businesses, this means moving beyond category-level estimates to product- and supplier-level data that is traceable, auditable, and aligned with GHG Protocol and SBTi FLAG methodology.
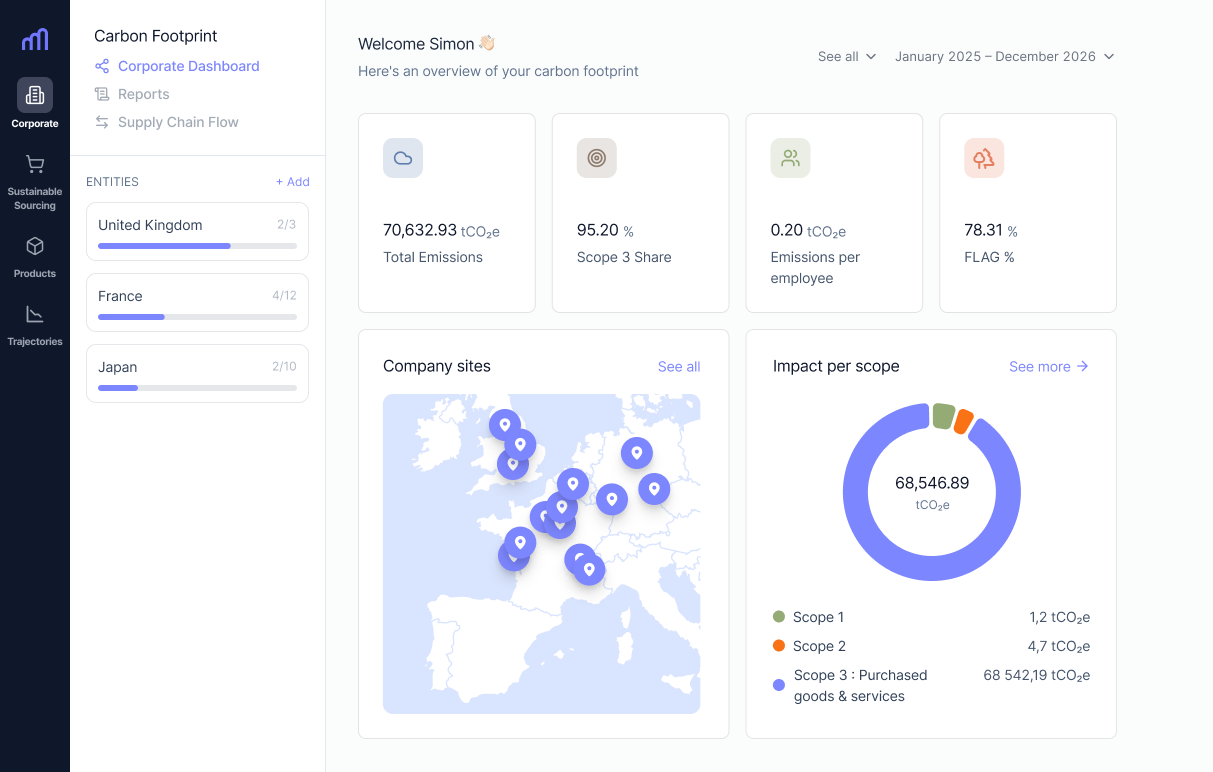
A product carbon footprint (PCF) measures the emissions associated with a single product across its lifecycle, from raw ingredient to end consumer. A corporate carbon footprint aggregates emissions across an entire organisation. The two are closely linked: in Carbon Maps, Scope 3.1 (purchased goods and services) flows automatically from product-level data into the corporate footprint, eliminating manual estimation and ensuring consistency between the two.
SBTi's Forest, Land and Agriculture (FLAG) guidance requires food companies with significant land-based emissions to set separate reduction targets for their agricultural supply chain. This means Scope 3.1 emissions, particularly those from livestock, land use change, and crop production, need to be measured and reported with a FLAG split. Carbon Maps generates this split automatically, so food companies can set and track FLAG-aligned targets without additional manual calculation.
Talk to us about turning carbon data into real impact.