csrd & esrs reporting

The auditable data layer behind your CSRD report

For food and beverage, the hardest ESRS data points can't be filled in from a questionnaire. Carbon Maps computes them from real recipes and supplier data, every figure traced back to source.
results

One dataset, your whole environmental disclosure.

Build the data once and it flows into every ESRS environmental data point, each traced to source.
Mockup

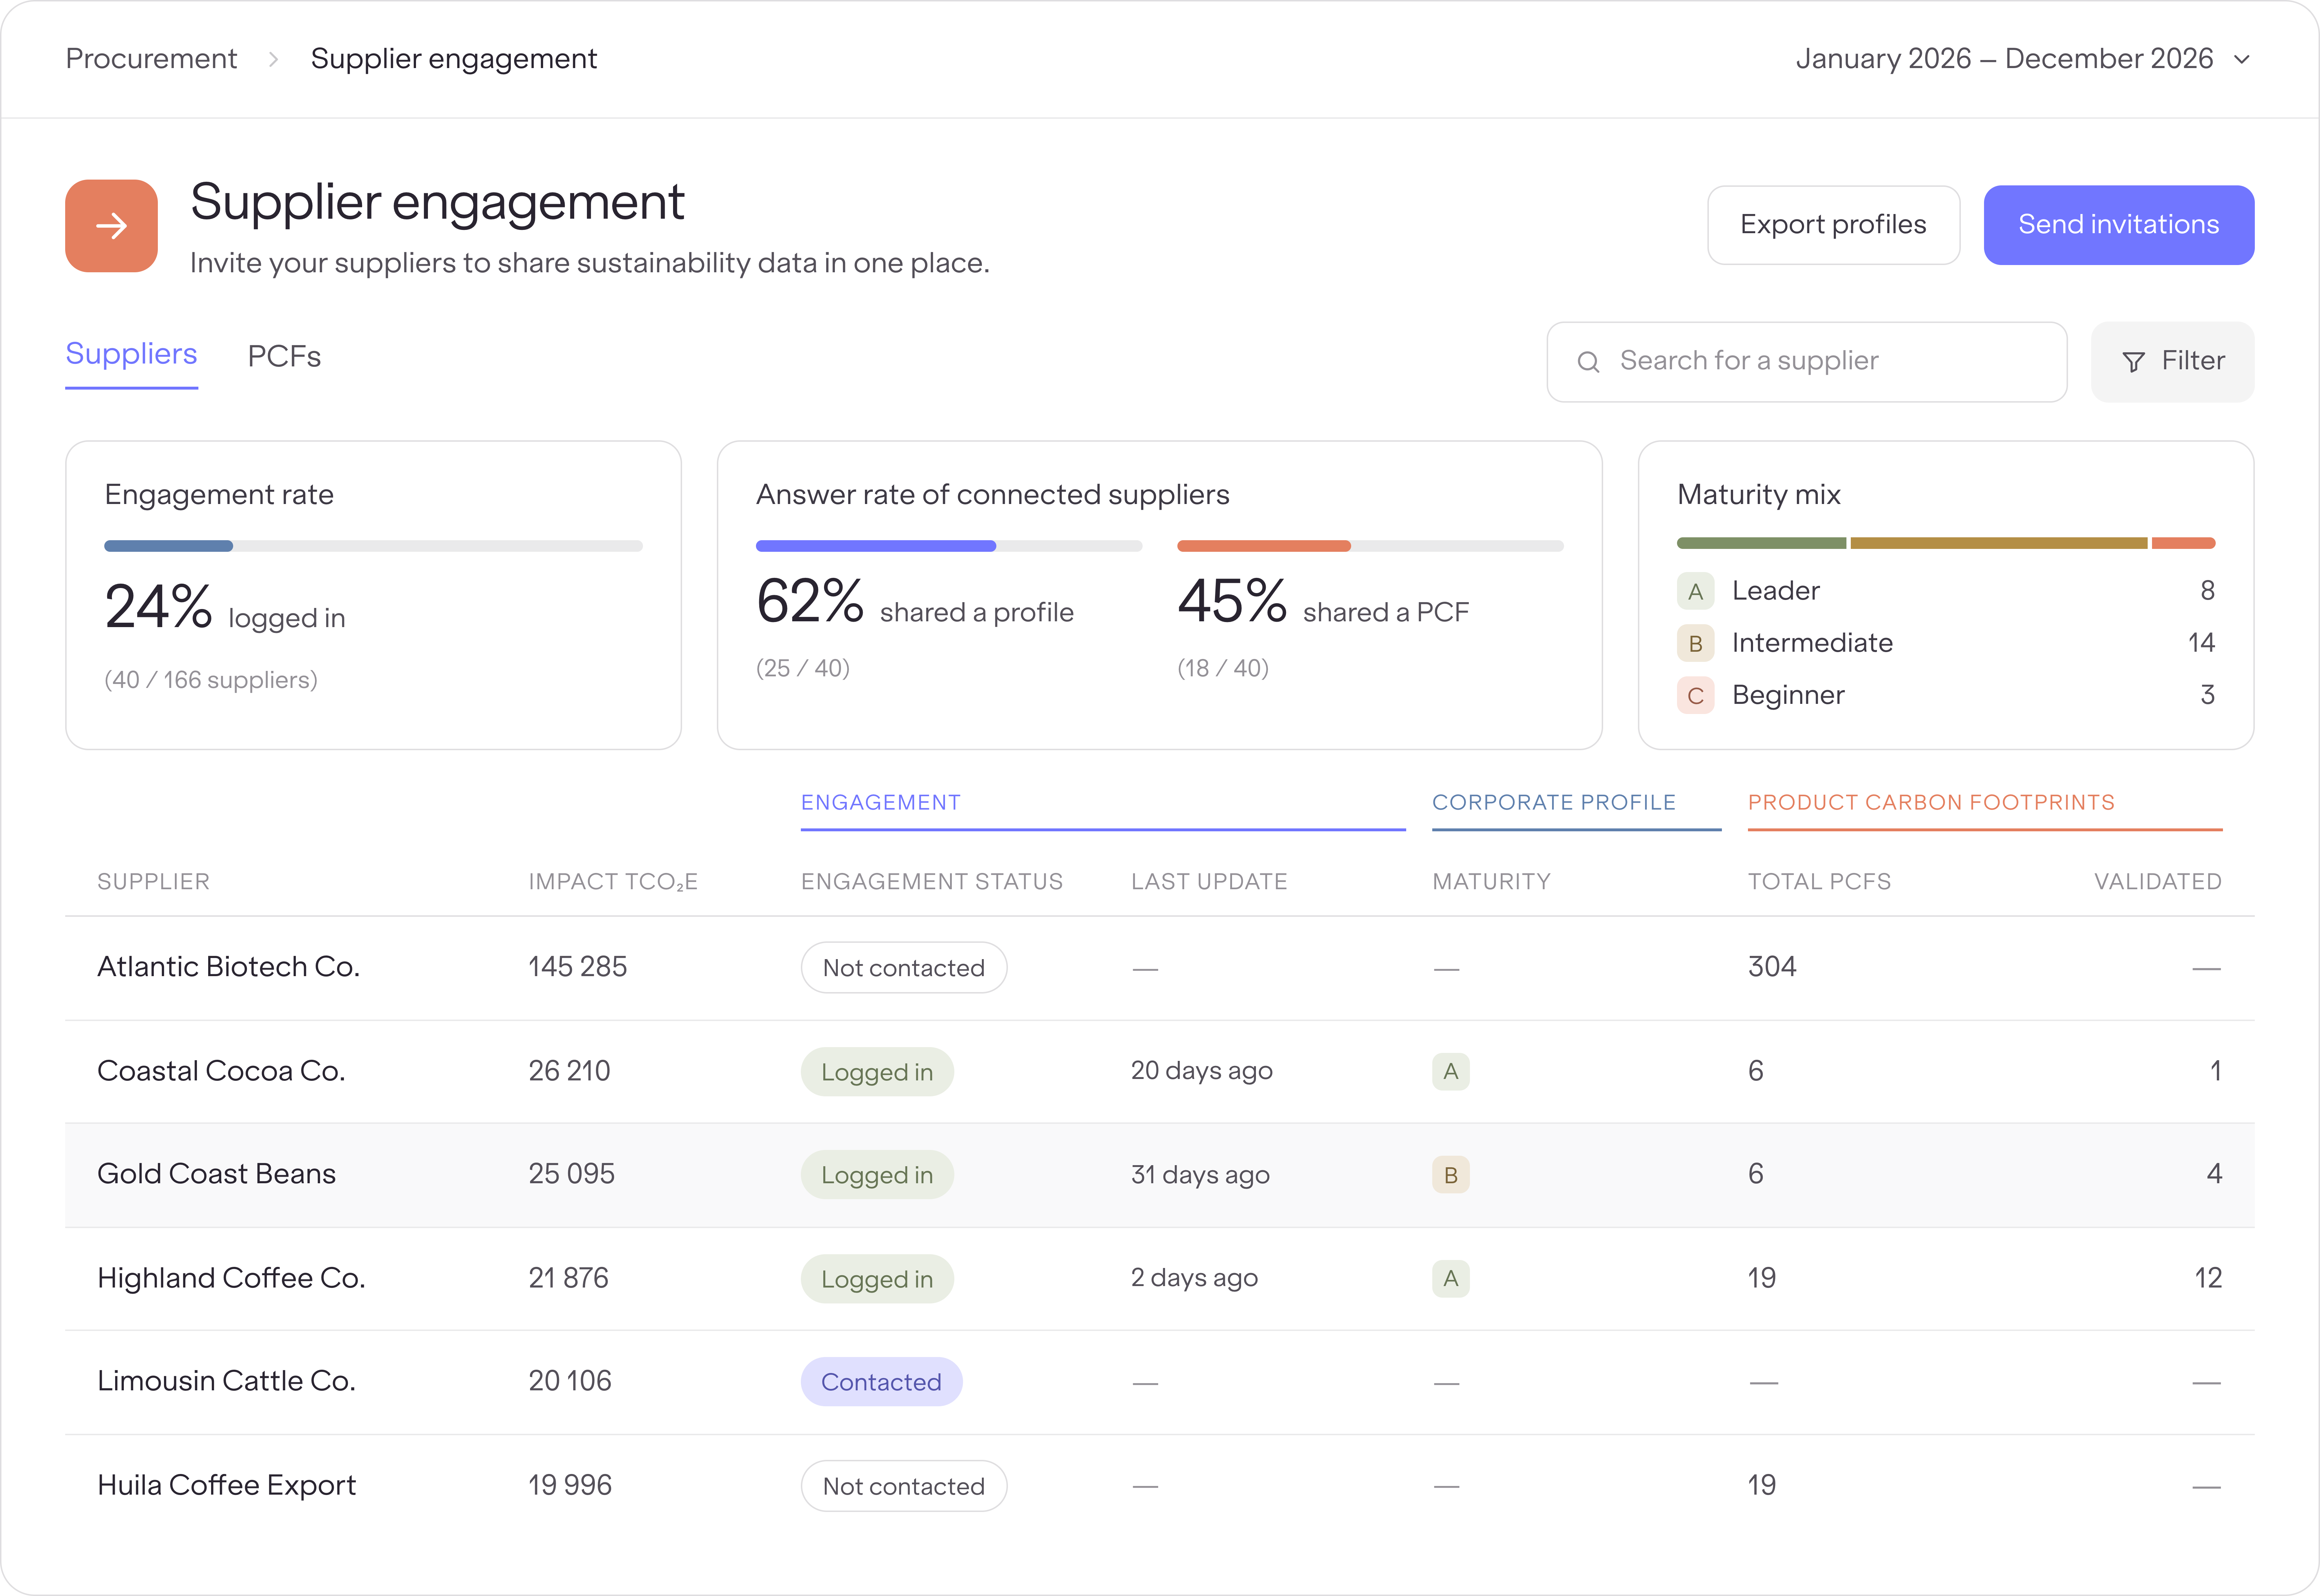
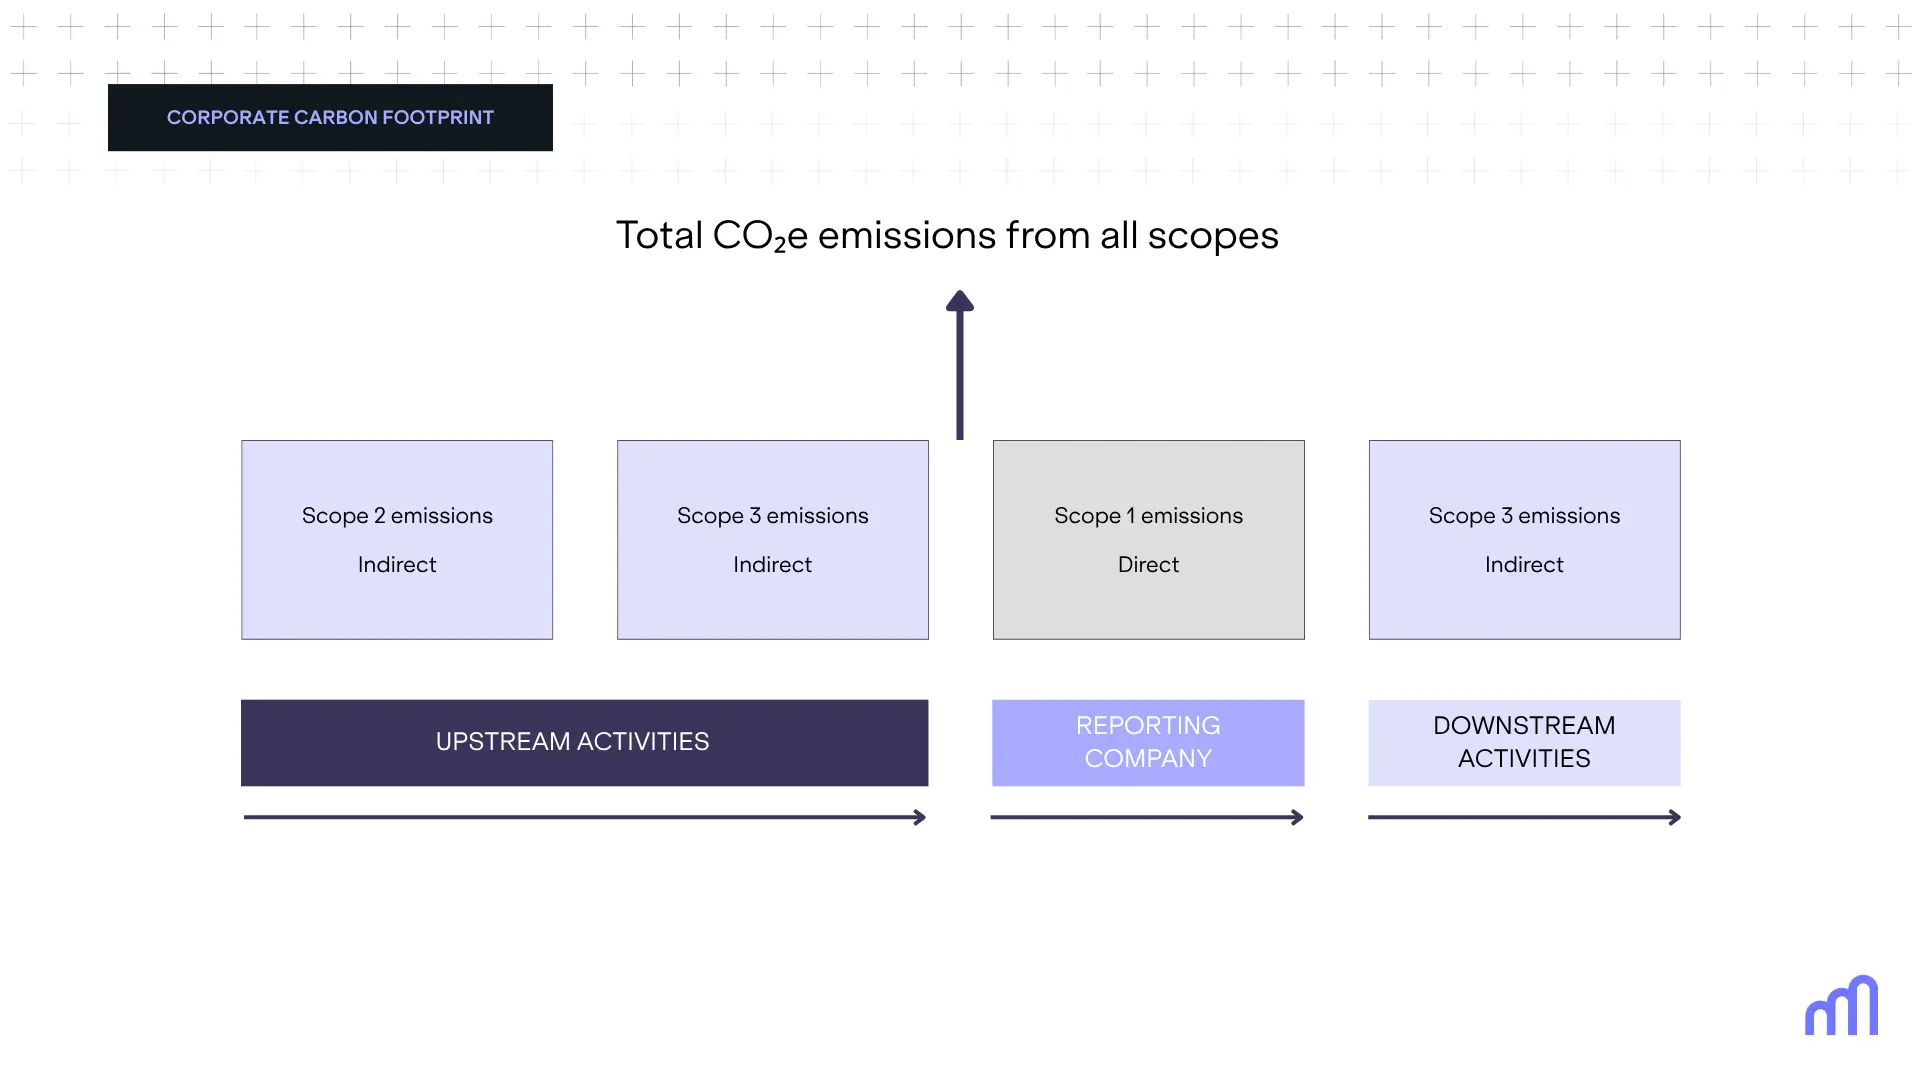
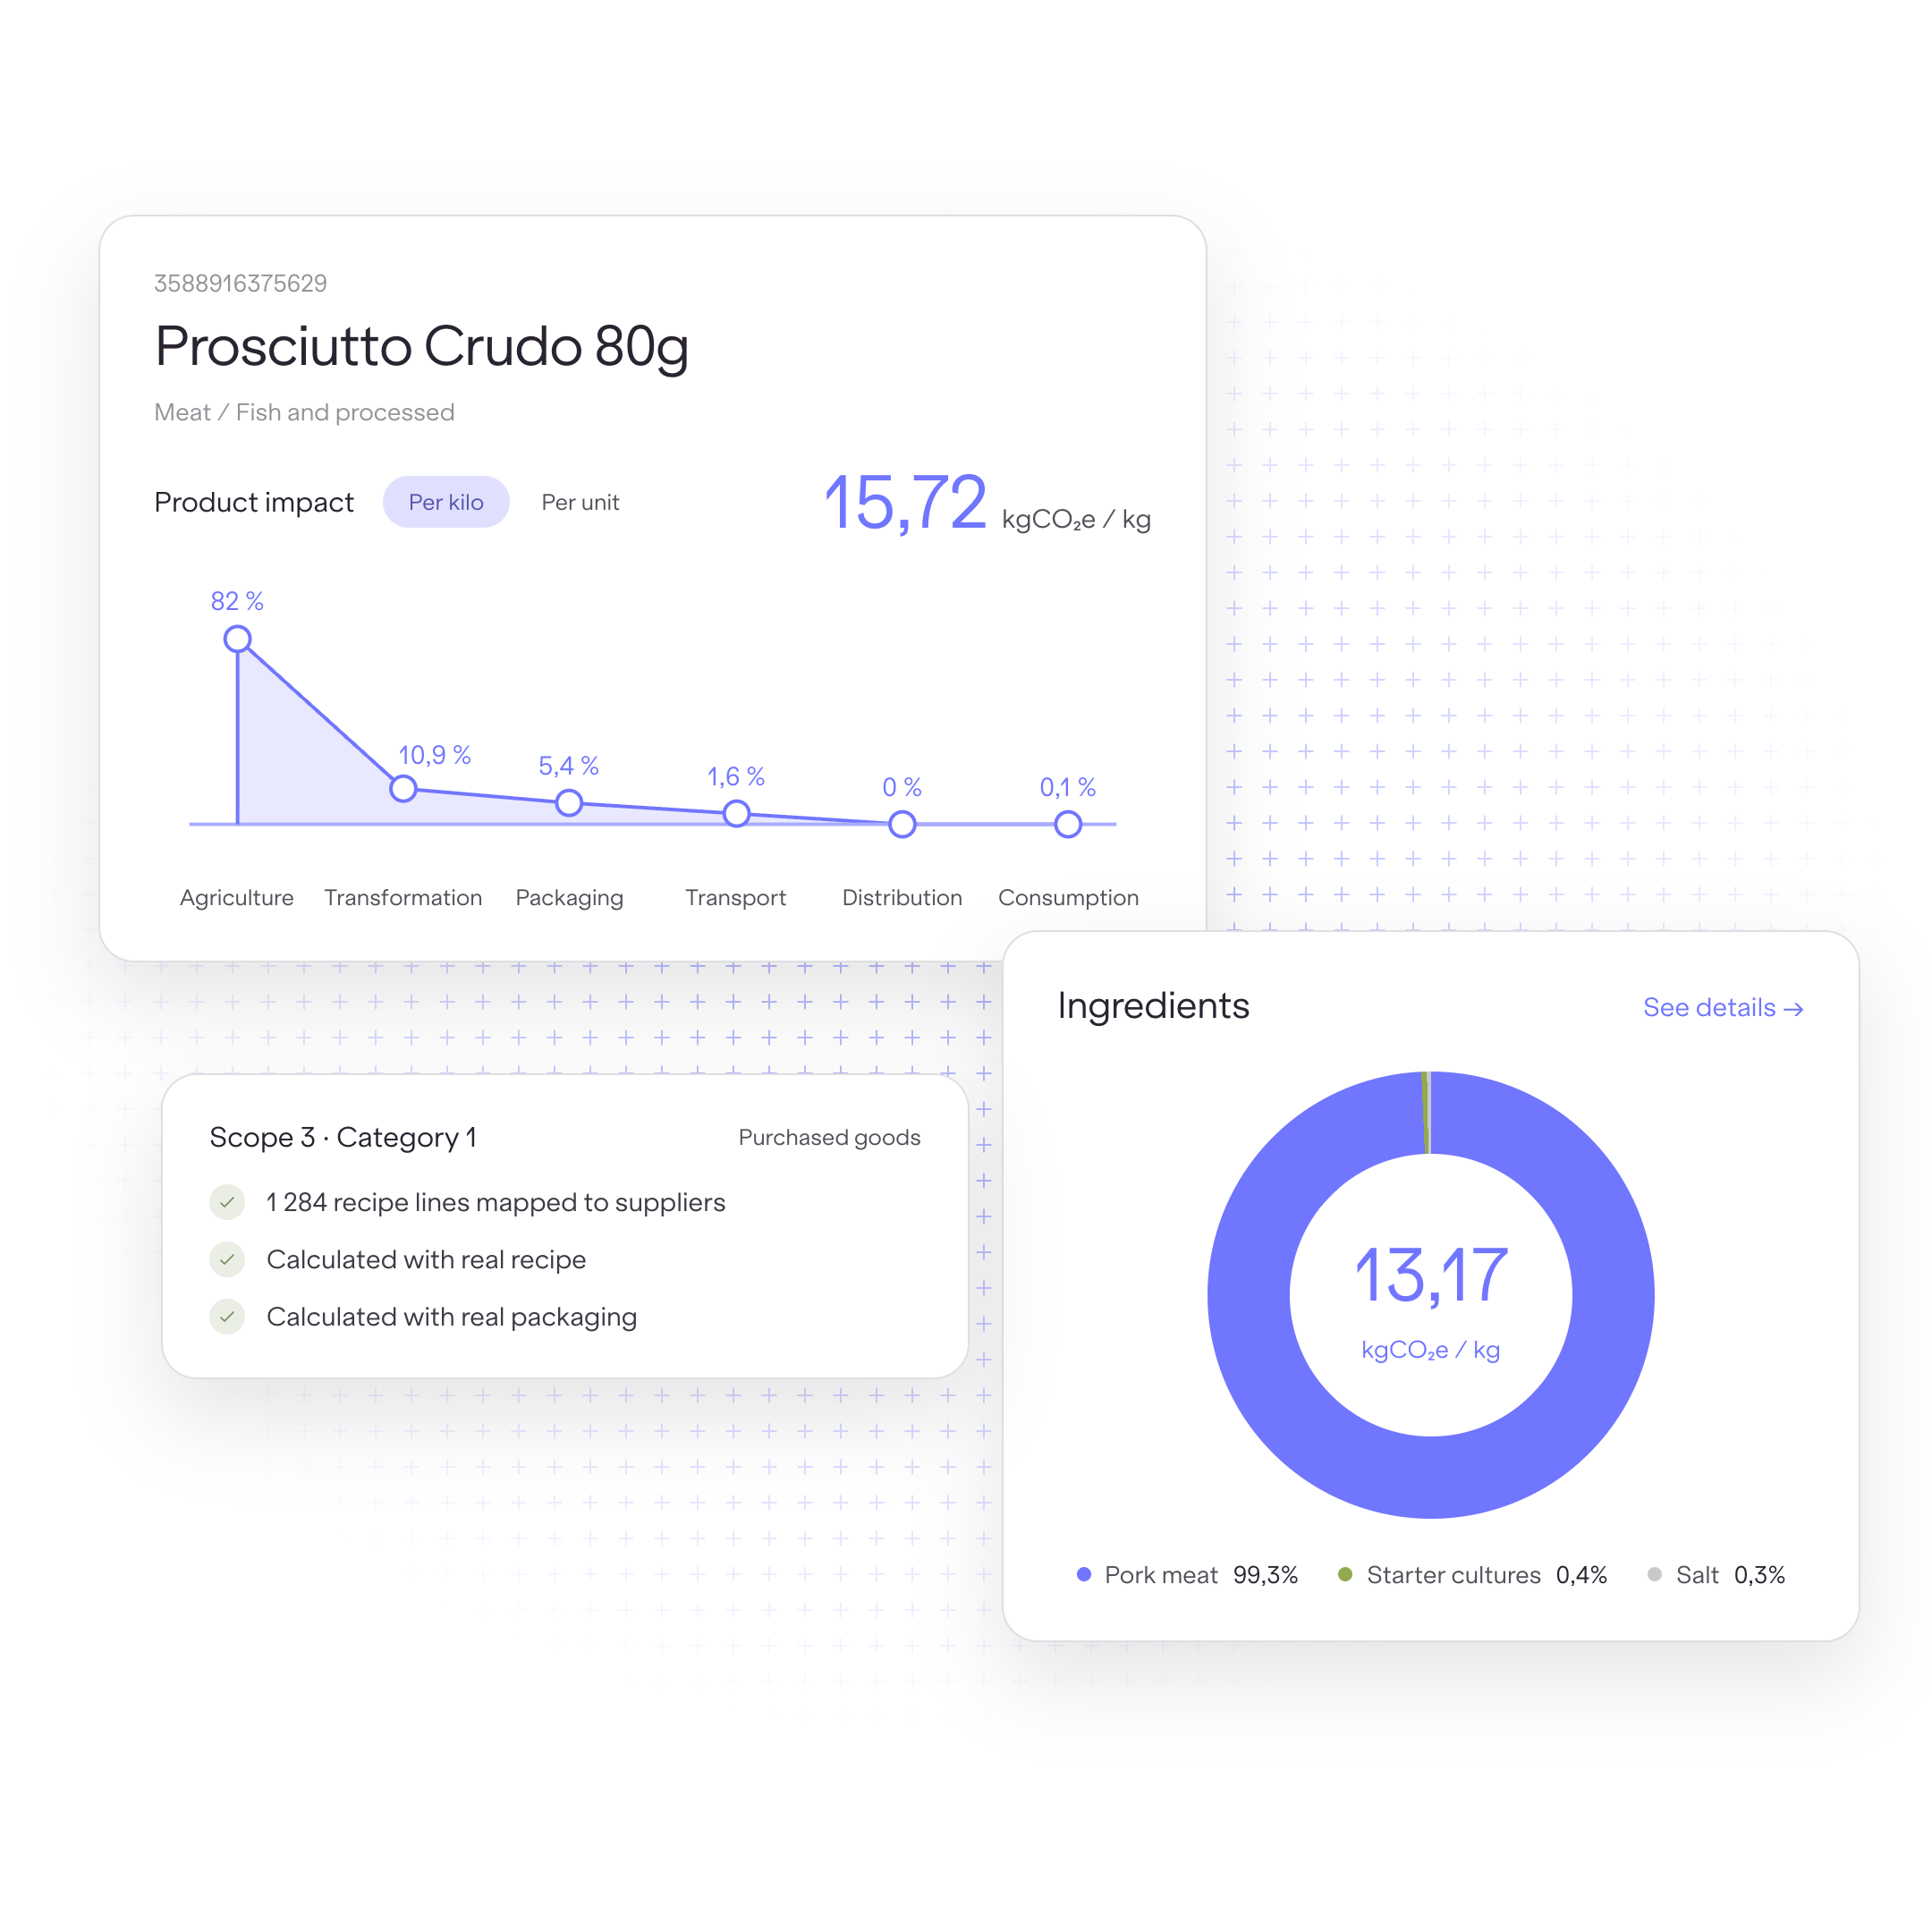
Compute Scope 3, don't estimate it

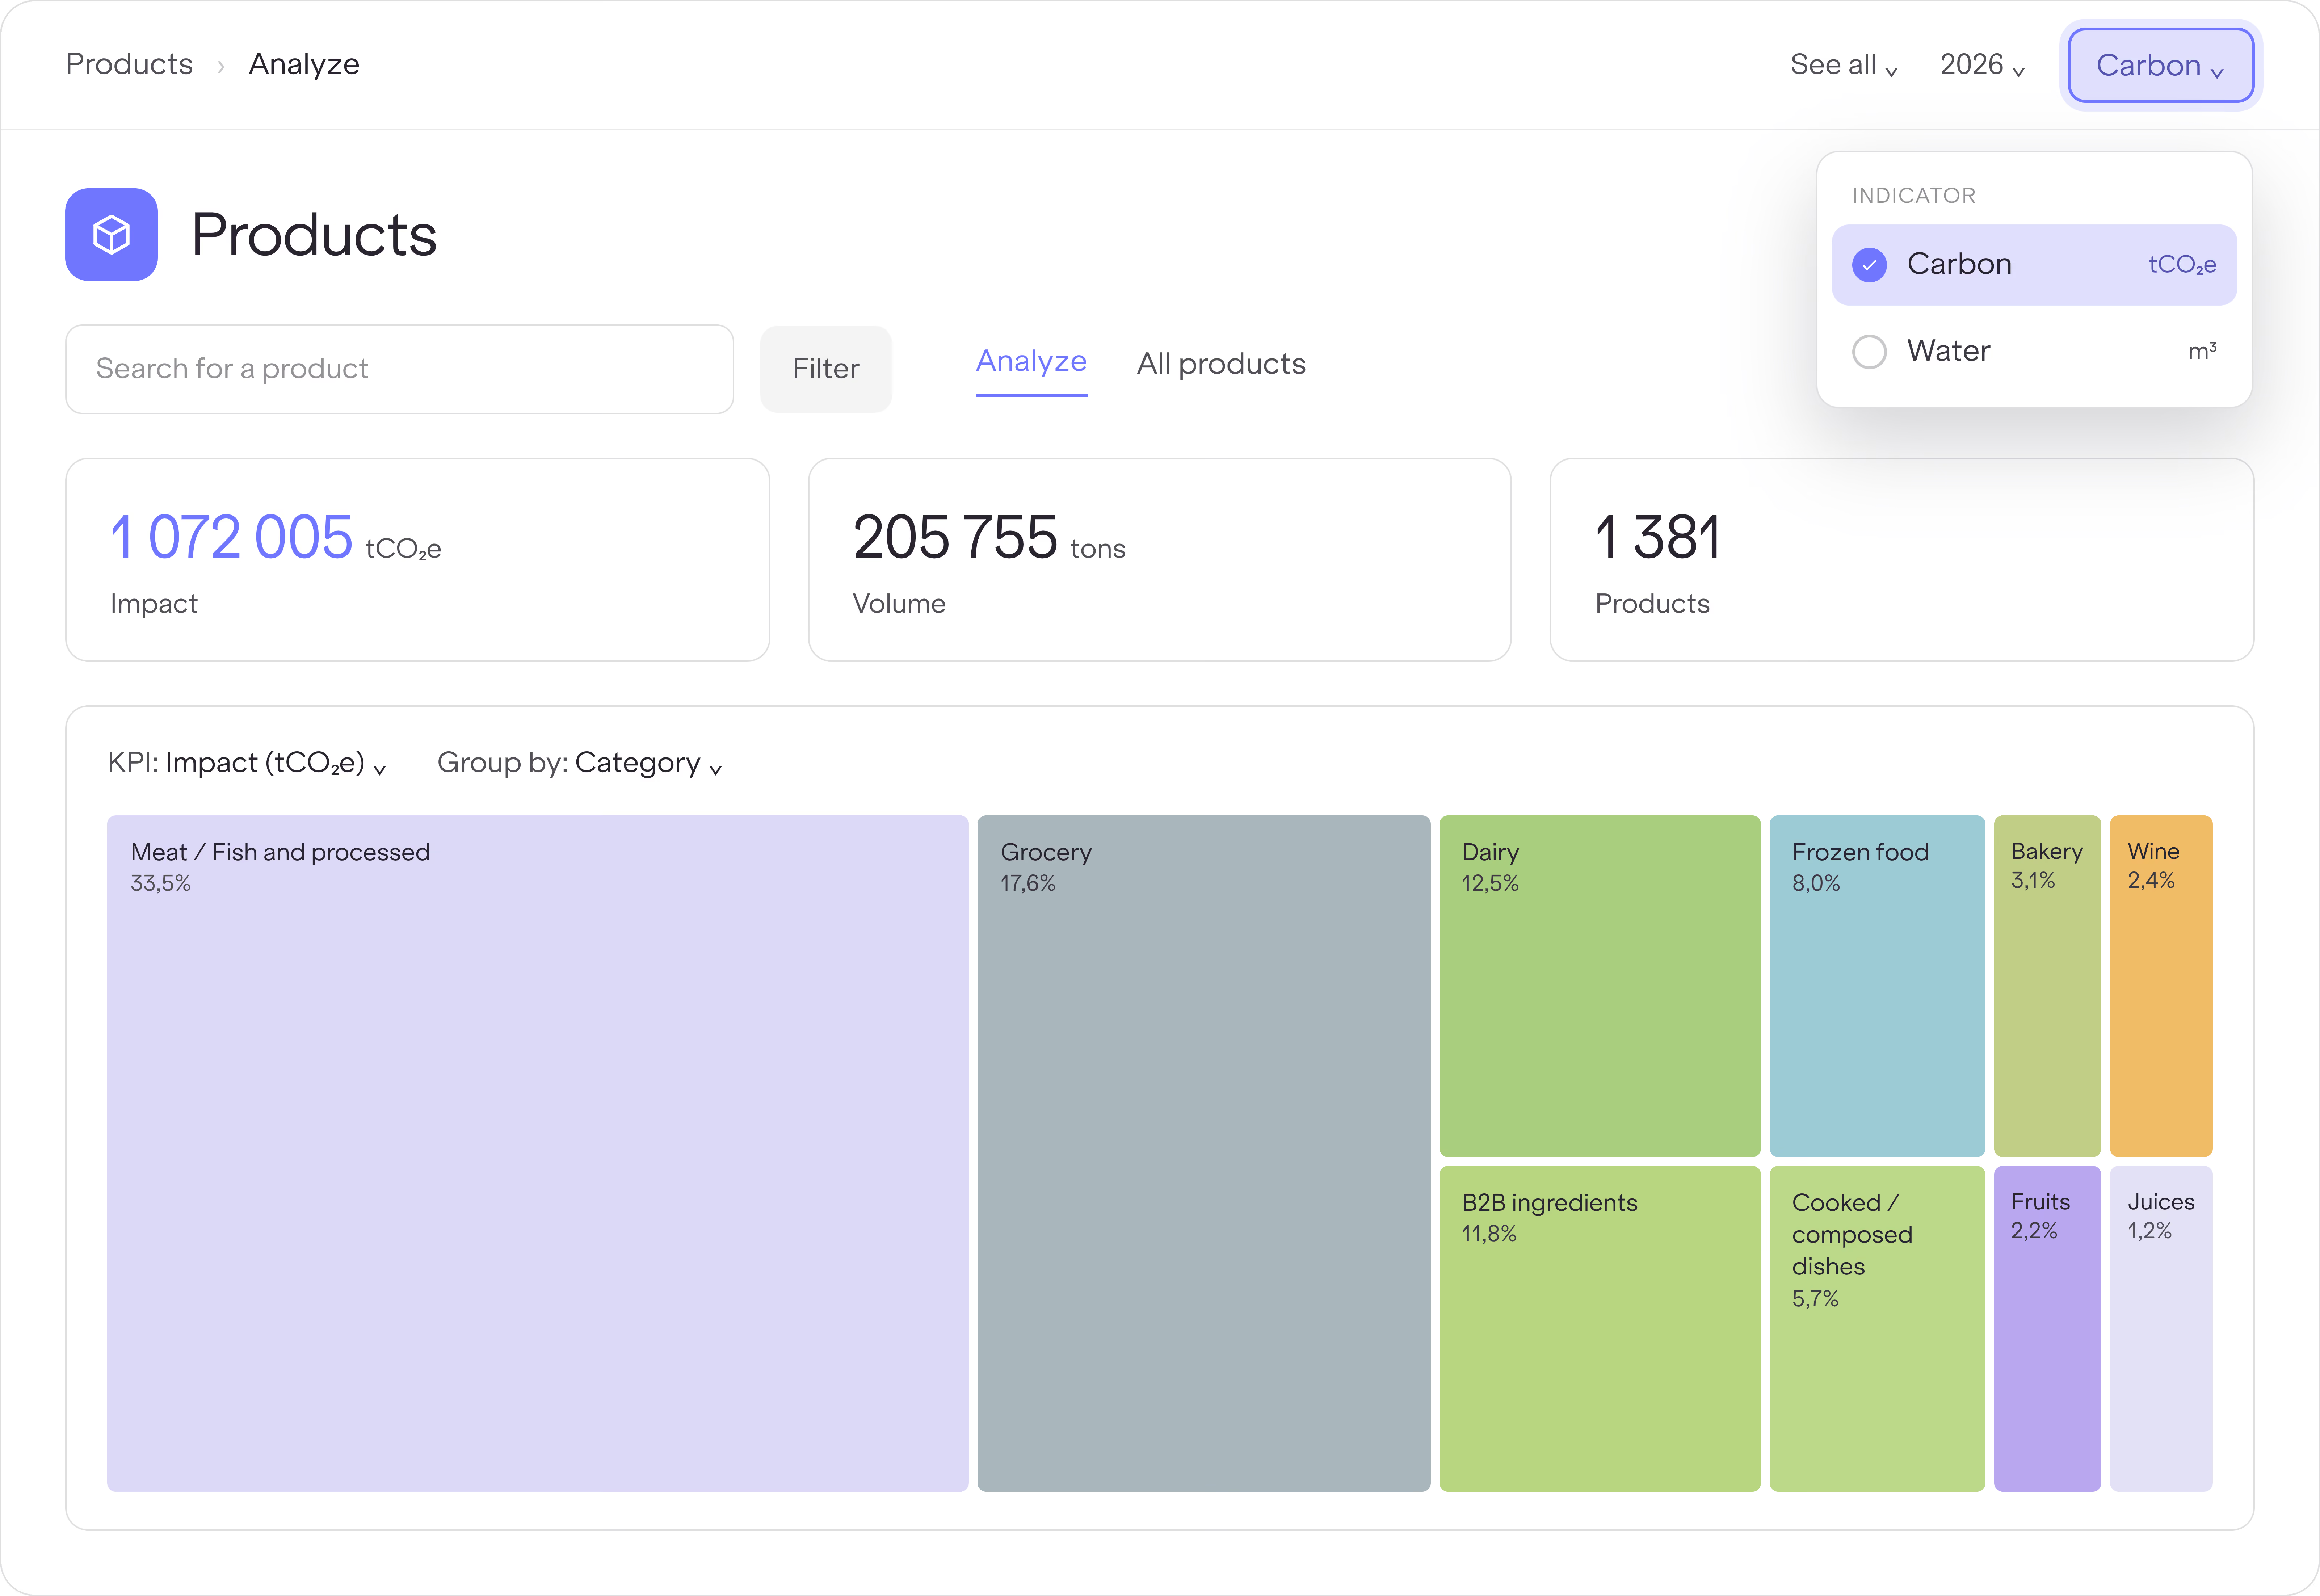
Scope 3 Category 1 from agriculture is the single hardest ESRS number. We compute it from real recipes and bills of materials, not sector averages, at product and ingredient level. The figure your auditor trusts.
Mockup

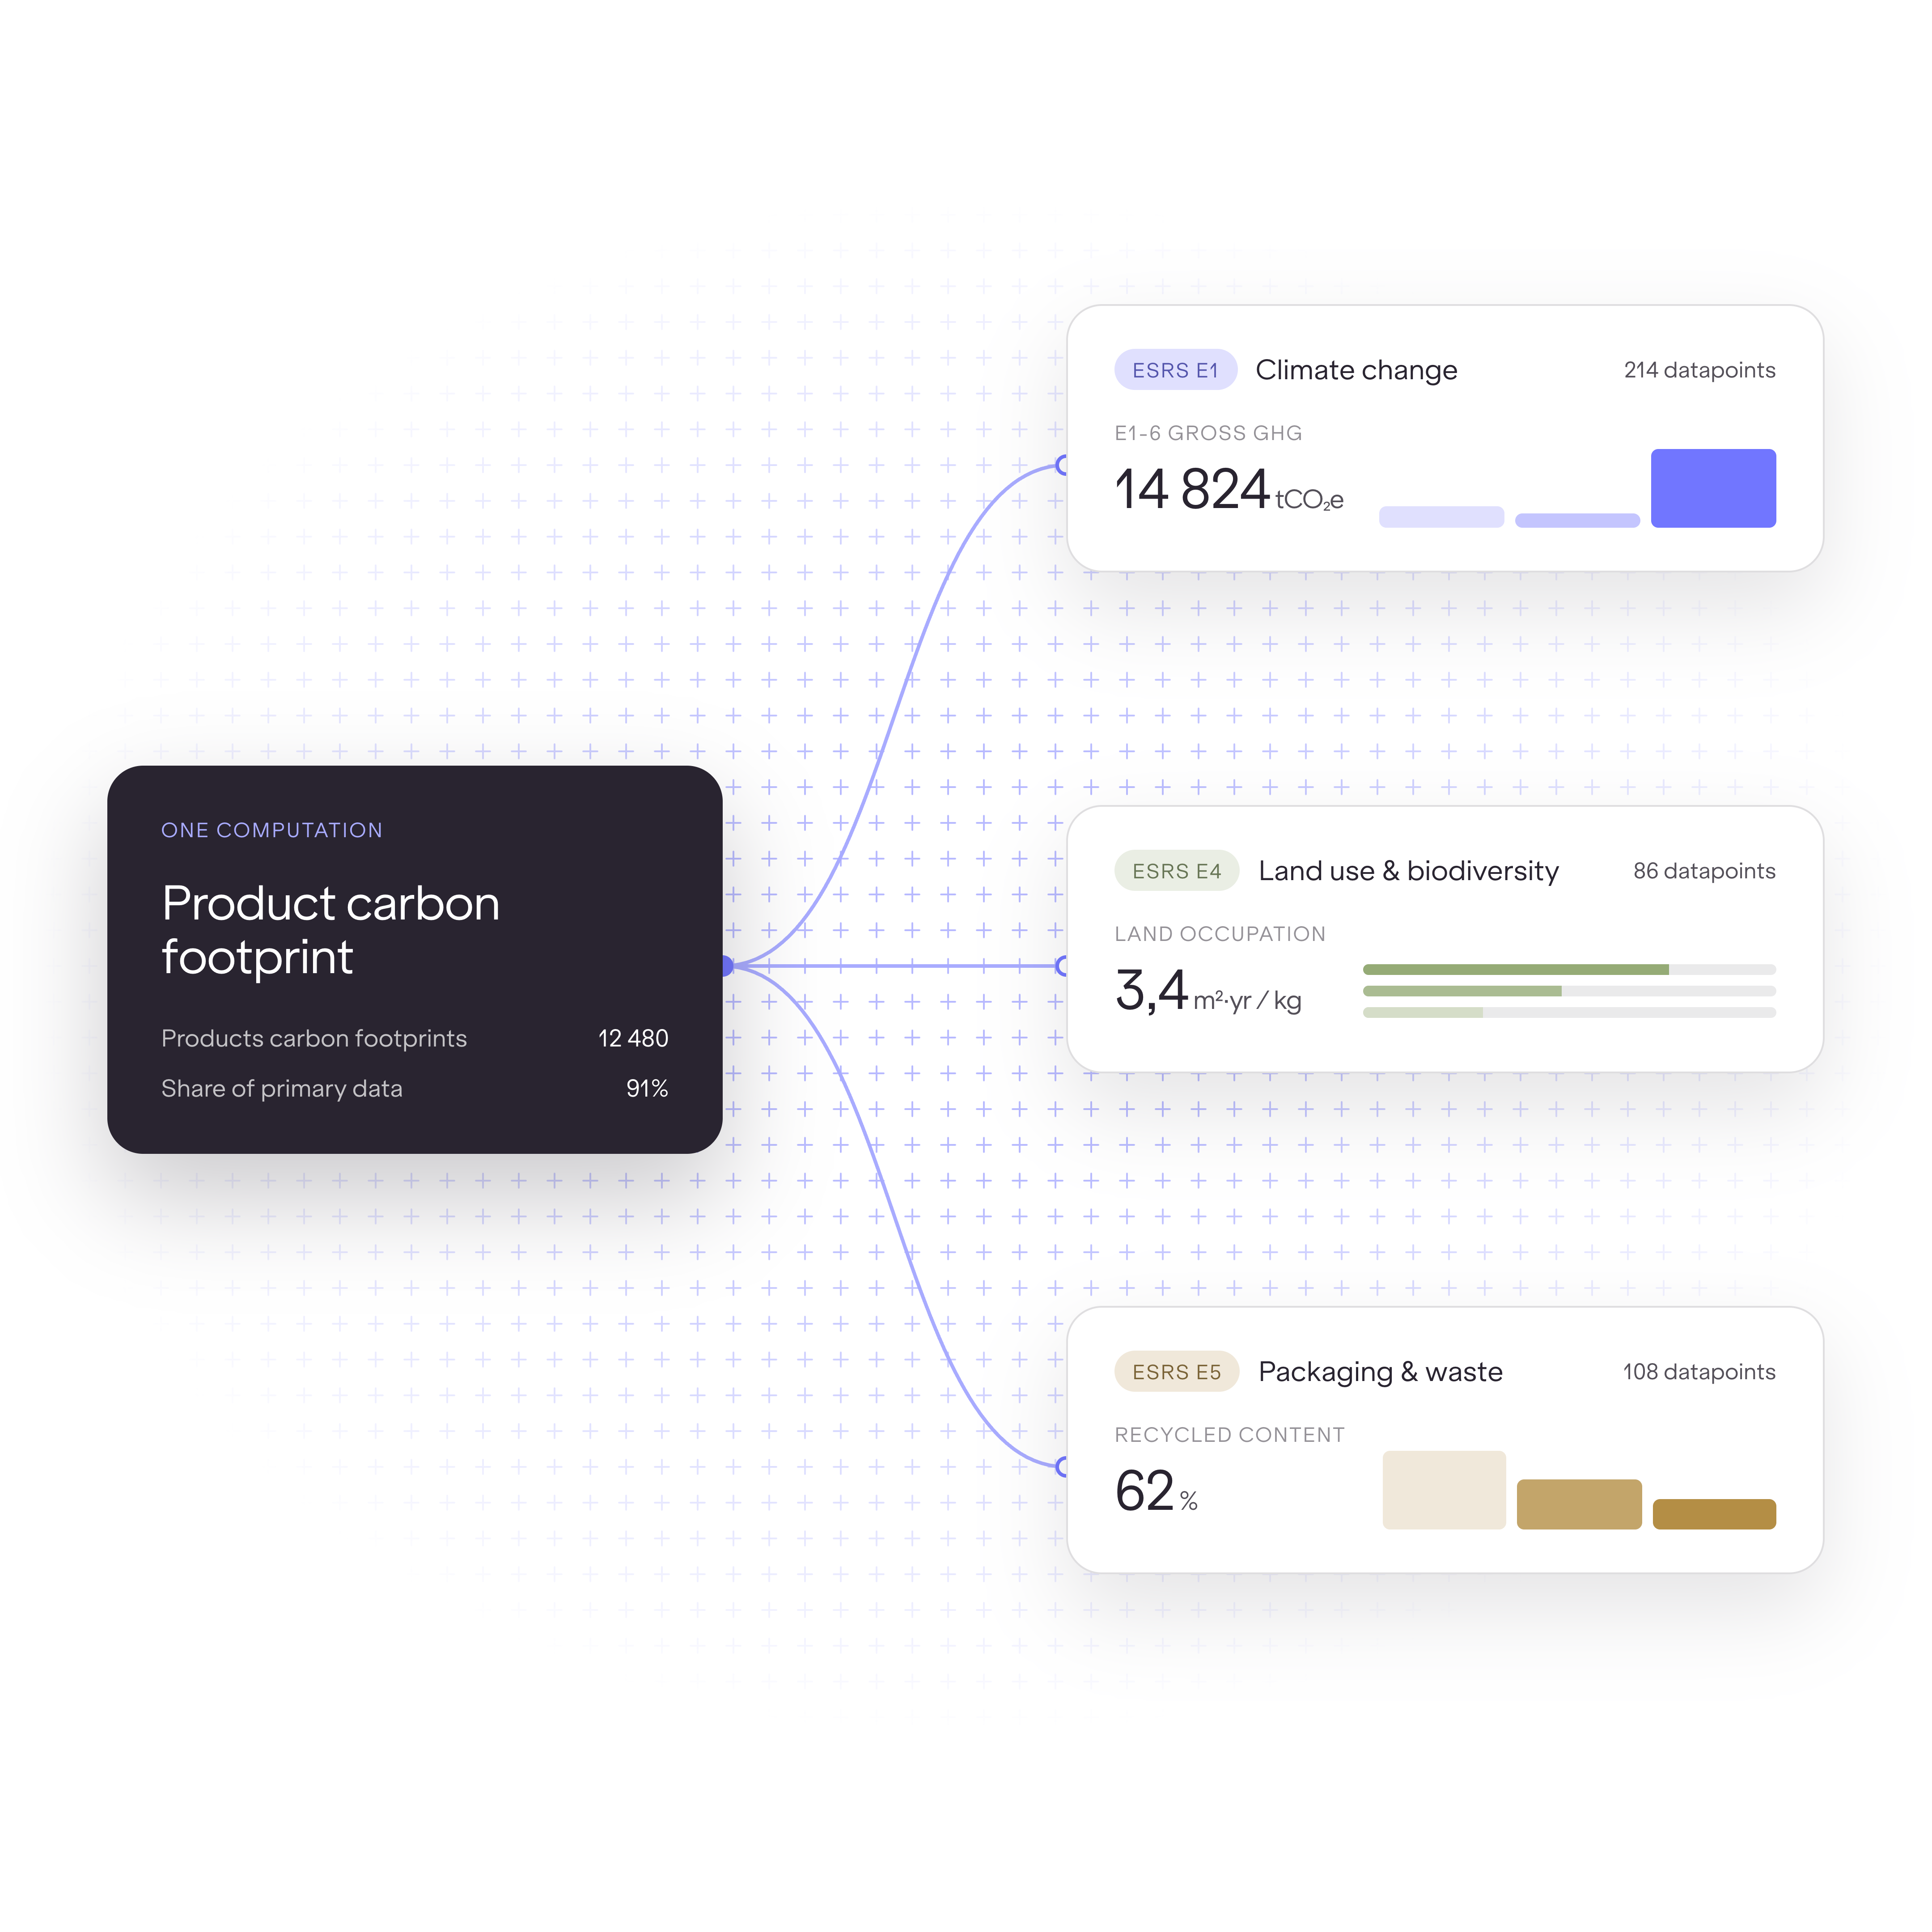
Report once, disclose everywhere

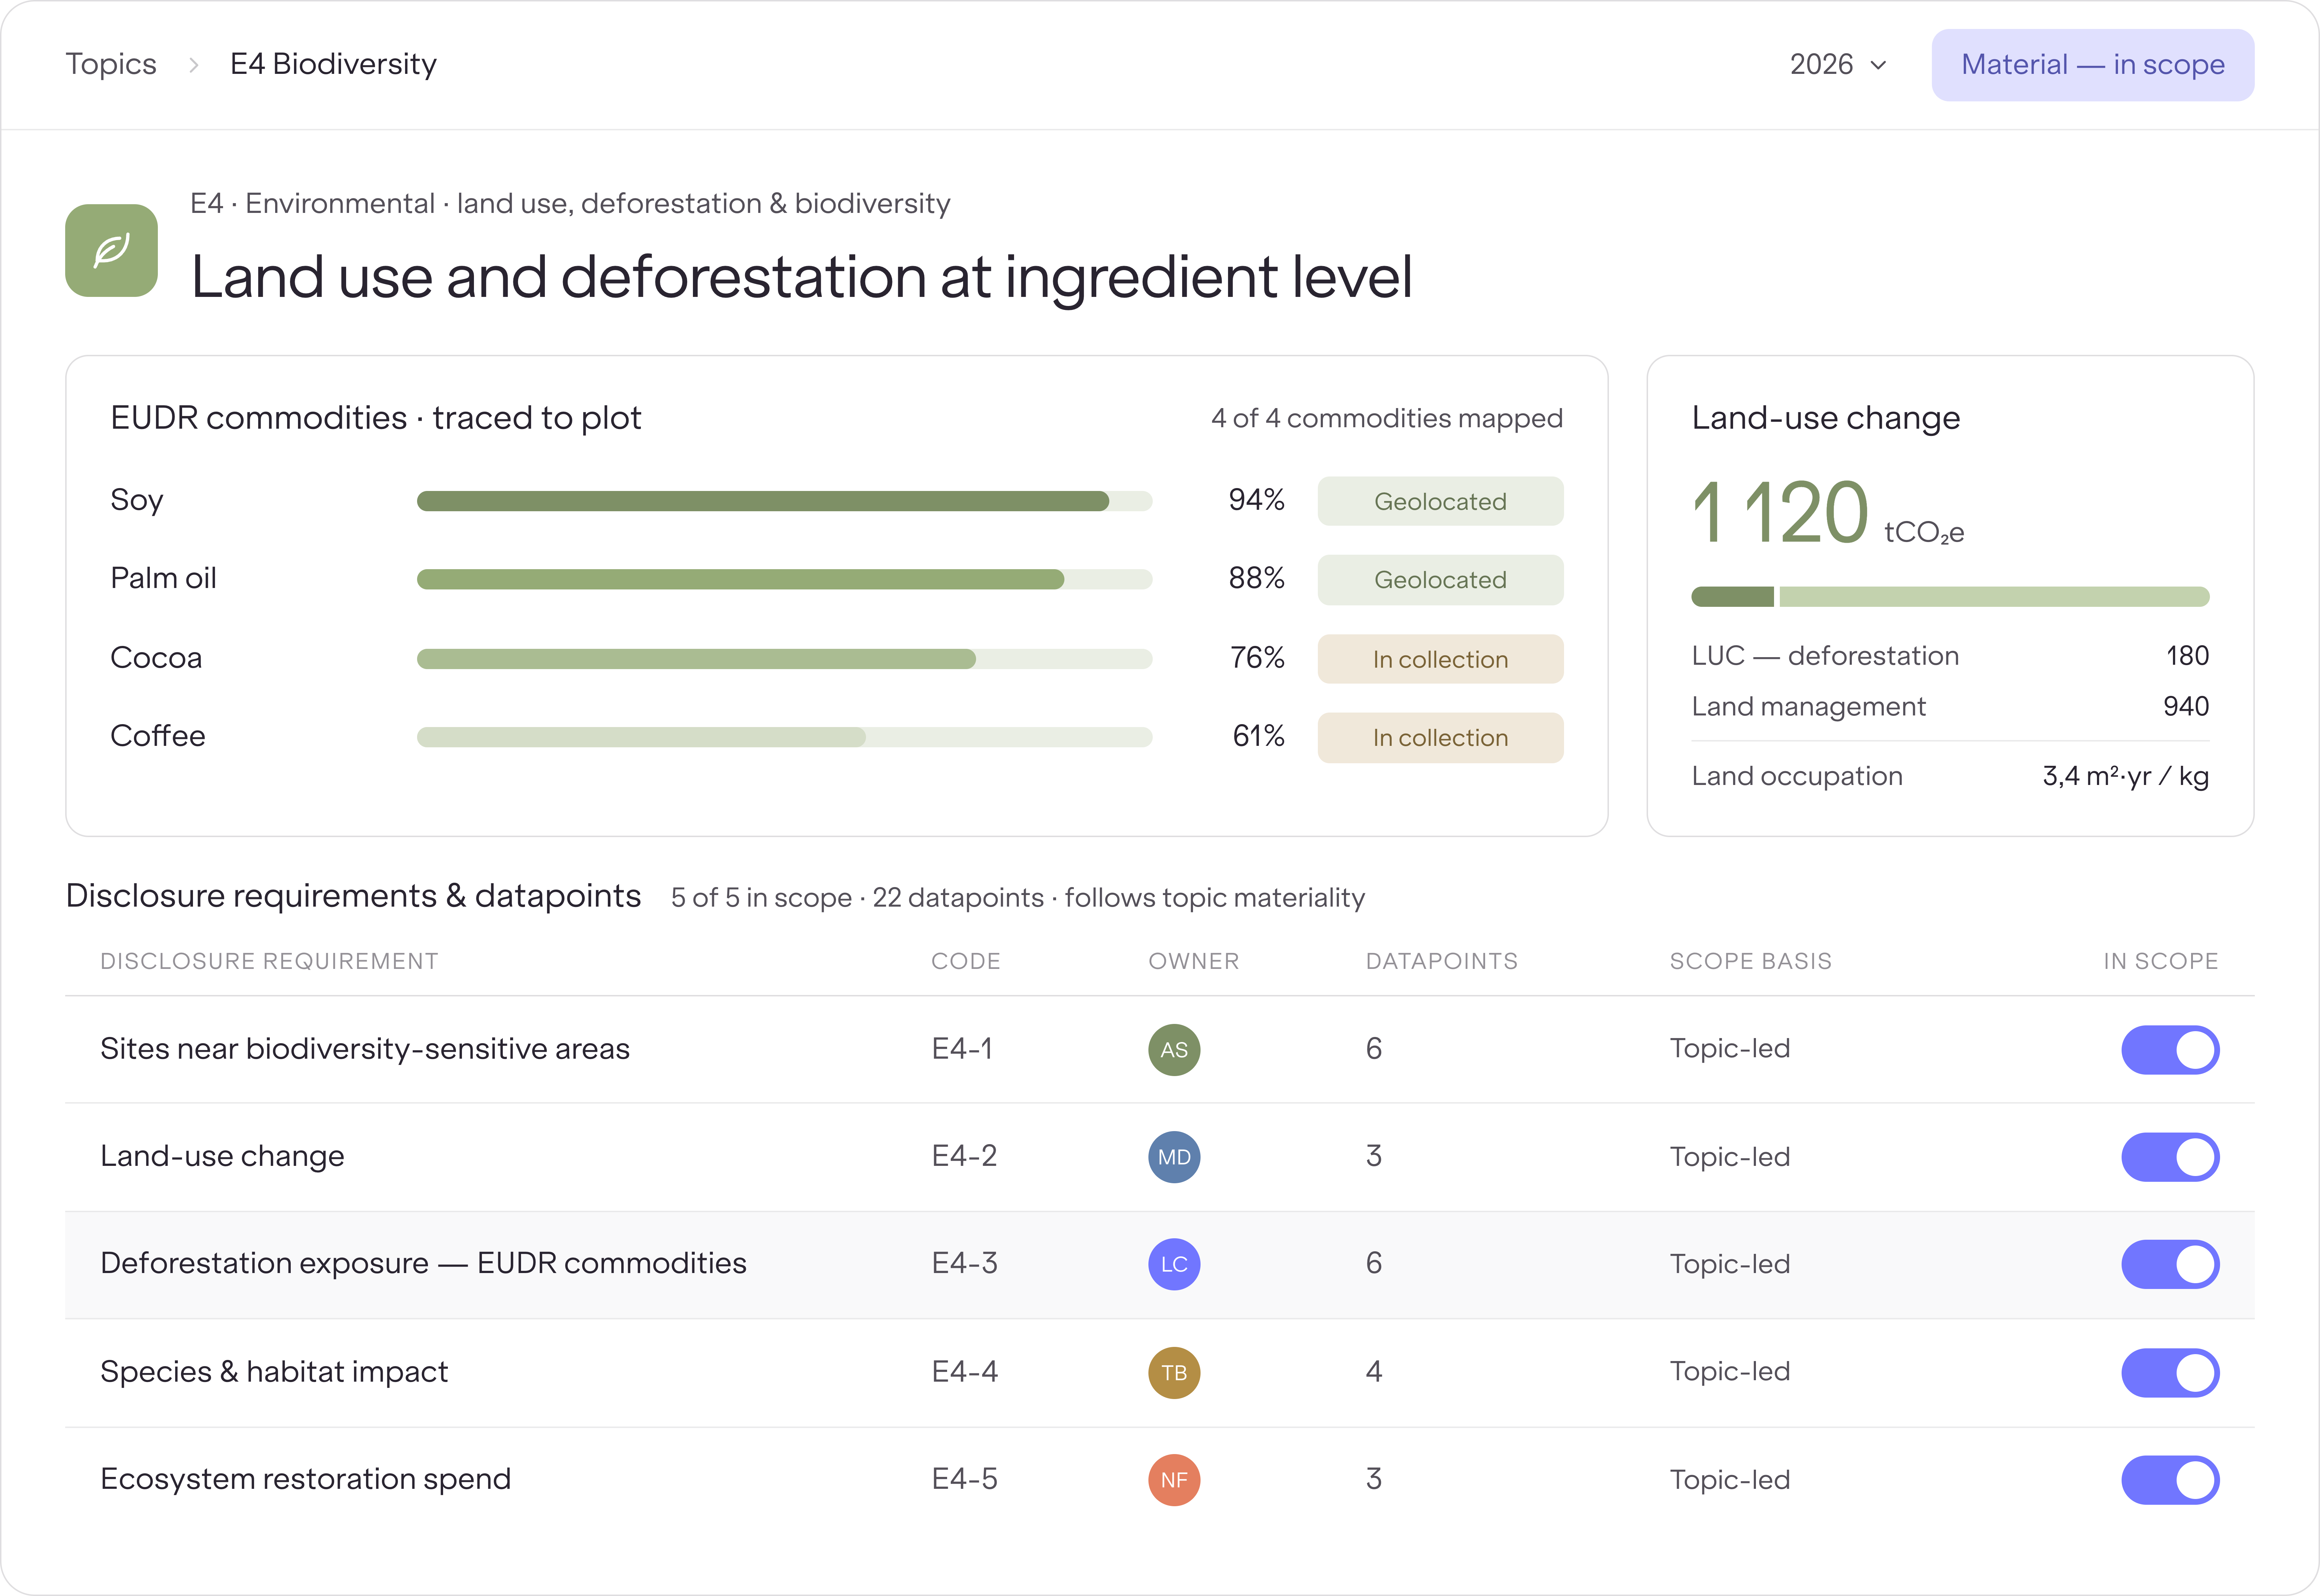
The data you build for your carbon footprint auto-produces ESRS data points across E1 climate, E4 land use and E5 packaging and waste. One computation, multiple disclosures.
Mockup

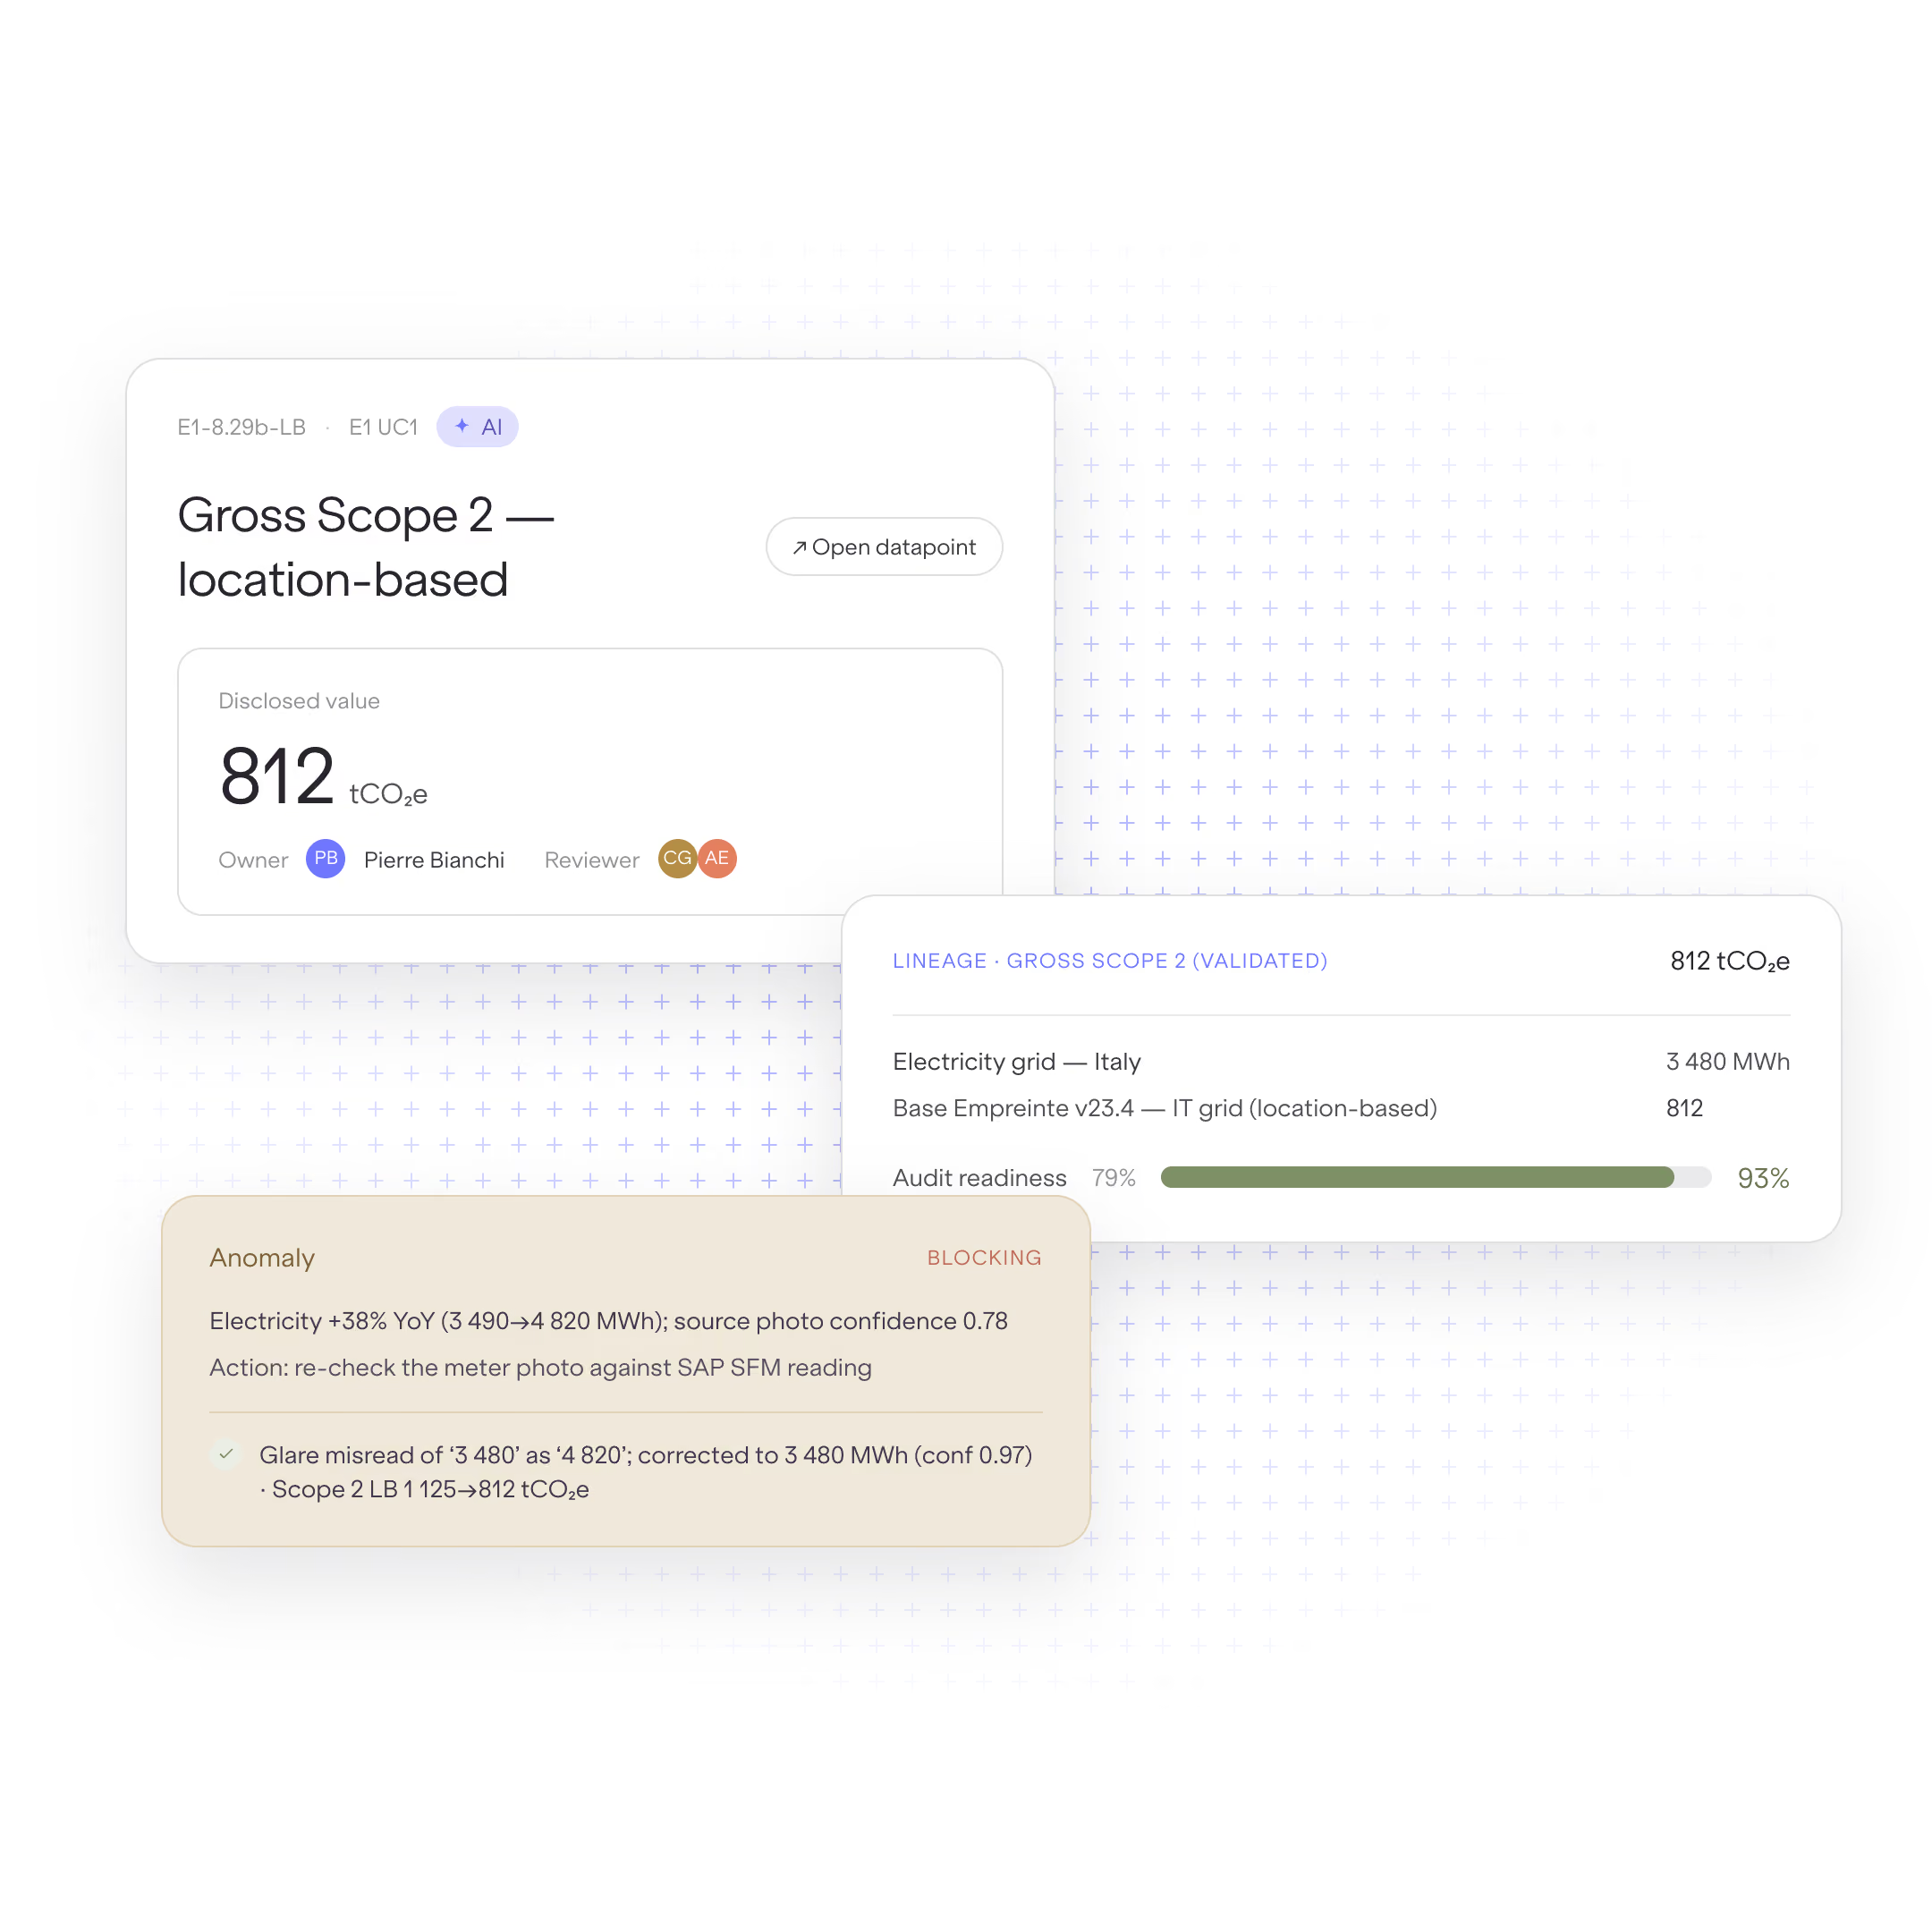
Auditable by design

Every figure carries lineage back to its source document and emission-factor version, recomputed each year against a persistent product database. Exactly what a limited-assurance audit tests for.

Built for the ESRS data points that stop everyone else

One shared data model. Every platform capability answers a requirement that generic ESG tools leave as a blank field.
Why food and beverage teams choose Carbon Maps for CSRD

A side-by-side look at Scope 3, supplier data and audit readiness.

Without Carbon Maps

With Carbon Maps

Scope 3 Category 1
Sector averages auditors increasingly challenge
Ingredient-level, traceable to actual recipes and sourcing
Product-level footprints
Unavailable or consultant one-offs
Every SKU, automated, updated when data changes
Supplier data
Manual, inconsistent, hard to scale
Structured collection at scale, ESRS-aligned templates, backed by emission factor databases auditors recognise
ESRS coverage
E1 only, or partial across standards
E1, E4 and E5 from one shared data model
Year-on-year reporting
Starts again each cycle
Persistent database, progress tracked automatically
Audit readiness
Gaps that risk a failed audit opinion
Every calculation documented and defensible
trust & compliance

Data built to survive the audit

Limited assurance means a third party checks your numbers. Carbon Maps is built so they hold up.

AriseHealth logoOE logo2020INC logoThe Paak logo
  • Our carbon accounting is validated by Bureau Veritas against ISO 14040, 14044 and 14067, and our PACT Methodology V3 is independently validated by TÜV Rheinland under ISO 14064-3. The standards your auditor already recognises.

  • Each number carries lineage back to its source document and emission-factor version. When an auditor asks why your Scope 3 figure is credible, you have the evidence trail, not just an estimate.

  • A persistent product database recomputes your footprint each reporting cycle, so your data stays comparable and audit-ready as requirements tighten toward reasonable assurance.
FAQ

What food & bev teams ask about CSRD

The compliance, scope and audit questions that come up most often.
Does Carbon Maps produce my full CSRD report?
+
Carbon Maps produces the auditable environmental data behind a CSRD report, not the full report itself. Carbon Maps computes Scope 3 emissions, land use, packaging and water at product and ingredient level. A food or beverage company's consultants, legal team and auditors then use that data to draft the ESRS narrative, obtain assurance and publish the sustainability report. Carbon Maps gives those teams real computed evidence to work from instead of estimates.
Does CSRD still apply to a food company under 1,000 employees after the Omnibus Directive?
+
The EU Omnibus Directive raised the CSRD thresholds, so many food and beverage companies under 1,000 employees are no longer mandatory reporters. However, if a company's largest customers are large EU food businesses, those customers must still report their own supply chain emissions and will request product-level emissions data from their suppliers. The obligation to provide supply-chain data to customers does not disappear when a company falls below the CSRD reporting threshold.
Which ESRS data points does Carbon Maps cover?
+
Carbon Maps covers the environmental ESRS data points that depend on real supply-chain data: ESRS E1 climate (including Scope 3 Category 1 emissions from agriculture), ESRS E4 land use and deforestation, and ESRS E5 packaging and waste. These ESRS data points are the ones generic ESG tools leave as blank fields, because these data points cannot be computed without product-level lifecycle assessment data.
Why can't a generic ESG platform compute food and beverage Scope 3 emissions?
+
Most generic ESG platforms are form-fillers: the platform provides a questionnaire and waits for a company to supply the answers. The hardest food and beverage data points, such as Scope 3 emissions from agriculture and ingredient-level land use, cannot be answered from a questionnaire. These data points must be computed from recipes, bills of materials and supplier data. Carbon Maps performs that computation, which is the capability generic ESG platforms lack.
How does Carbon Maps make Scope 3 figures hold up in a limited-assurance audit?
+
Carbon Maps gives every Scope 3 figure lineage back to its source document and emission-factor version, built on the emission-factor bases auditors recognise: Base Empreinte, Agribalyse, and Ecoinvent. Auditors increasingly challenge generic sector-average estimates for high-impact food supply chains, so a traceable, computed Scope 3 figure from Carbon Maps is far more defensible in a limited-assurance audit than an estimate.
Is Carbon Maps' carbon accounting methodology independently validated?
+
Carbon Maps' carbon accounting methodology is independently validated. Bureau Veritas validates the methodology against ISO 14040, 14044 and 14067, and TÜV Rheinland independently validates Carbon Maps' PACT Methodology V3 under ISO 14064-3.

Go deeper on CSRD and Scope 3

Practical guides for food and beverage teams preparing audit-ready disclosures.
Blog Image

Scope 3 Emissions: A Complete Guide to the 15 Categories

Read
arrow forward
Blog Image

Corporate Carbon Footprint: A Guide for the Food Sector

Read
arrow forward
Blog Image

EUDR & SBTi: How Carbon Maps Helps Food & Beverage Brands Comply With Both

Read
arrow forward