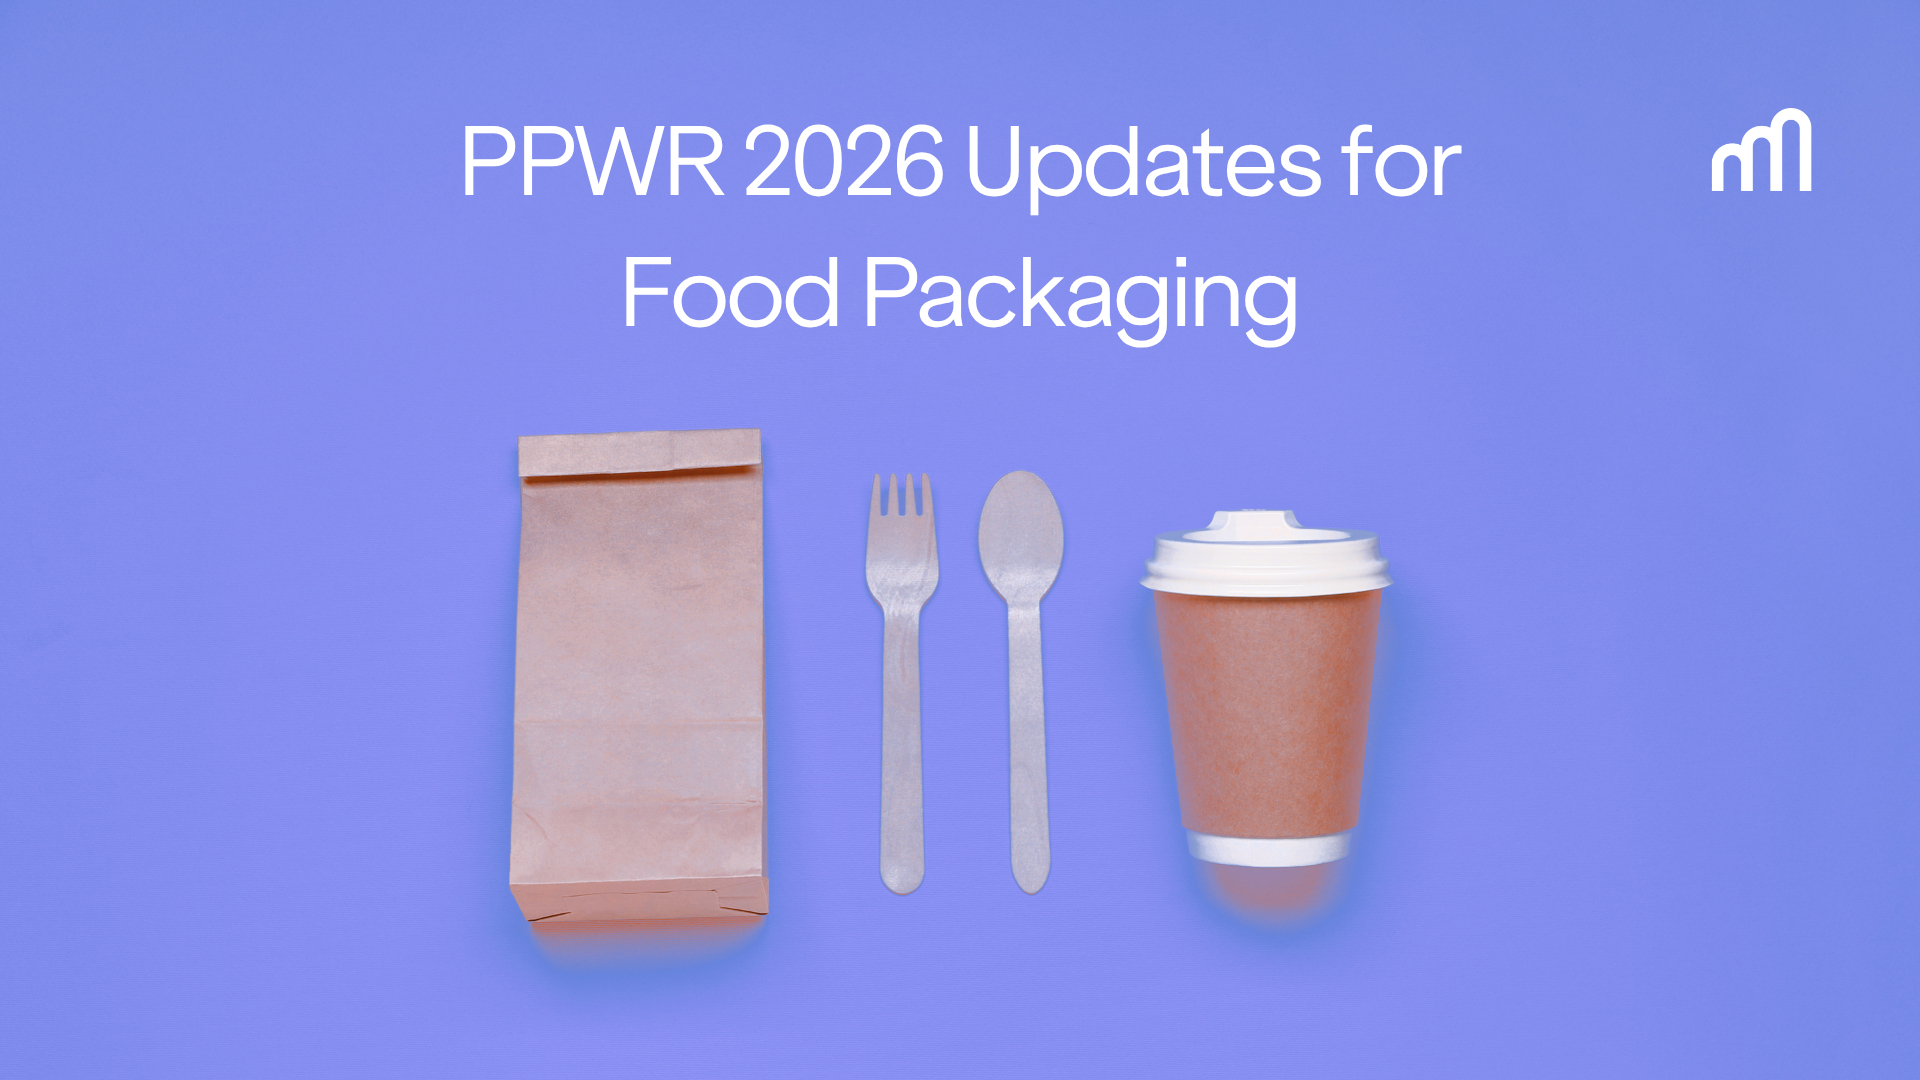
PPWR 2026 Updates for Food Packaging
PPWR applies from August 2026 with rules aimed at food packaging. It's less a design problem than a data one, and the same supplier process built for CSRD can cover it.
UK SRS Explained: What Food Companies Need to Know for 2027
The UK SRS mandates climate disclosure from January 2027. Here's what food and beverage companies and their suppliers need to know about Scope 3 obligations, supplier data requirements, and dual UK-EU compliance.
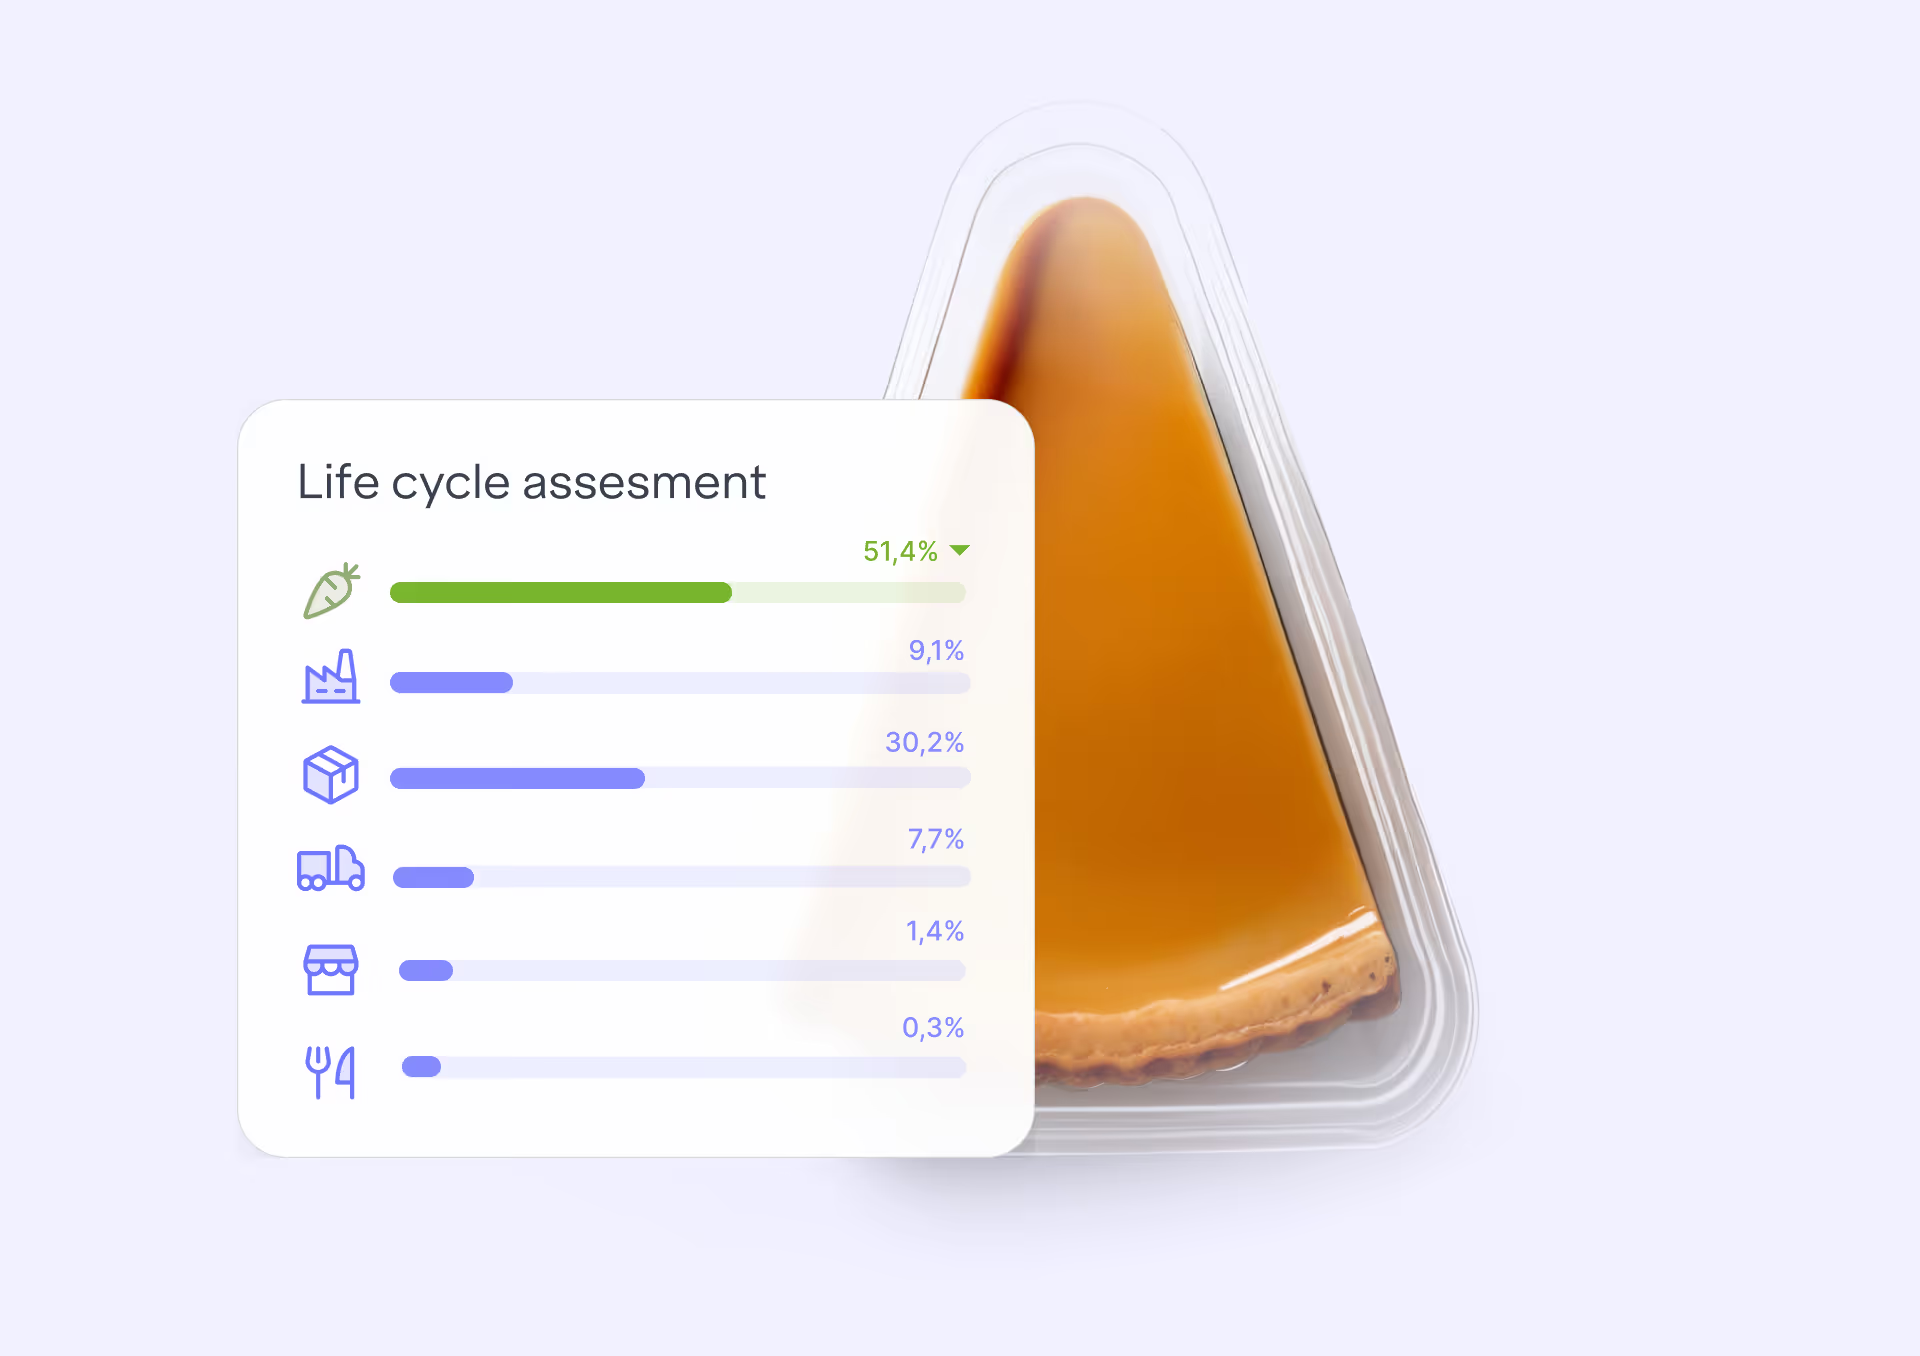
How Carbon Maps' PCF Calculation Methodology for the Food Industry Was Built to Be Trusted
Carbon Maps' PCF calculation methodology for the food industry has been independently validated by TÜV Rheinland against PACT V3 and the TfS PCF Guideline. Here's what that means for food companies evaluating PCF tools.


.png)


.png)