A green field and farm plot from above
cooperatives

Know the footprint hiding across your member farms

Turn the emissions scattered across thousands of independent farms into product-level footprints that every brand, board, and buyer can trust.
the challenge

Your footprint doesn't start in your factories. It starts on thousands of farms you don't operate.

Most of a cooperative's footprint sits upstream, in the milk, grain, or fruits coming off thousands of independent member farms, long before anything reaches a cooperative-owned plant.
That's FLAG and land-use emissions, the hardest category for a generic tool, dominating the number before a single production line is measured.
Consistent data from that many farms doesn't scale with a spreadsheet or an annual survey, and it still has to become one defensible footprint per product, holding up across every brand, business unit, and CSRD or SBTi FLAG requirement.
Why Carbon Maps

Purpose-built for what a cooperative actually is: many farms, one number.

Generic carbon tools treat agriculture as an add-on module. Carbon Maps grew up inside food and beverage supply chains, which is why it mirrors how a cooperative actually moves from farm to finished brand.
A direct line from the farm gate to the finished product
01

Model the footprint the way it's actually built: farm data in, product footprint out.

Carbon Maps links member-farmer production data, herd, or crop practices, directly to the finished products those farms feed into, instead of applying one blended agricultural average across the whole cooperative. Where farm-level data is thin for some members, food-specific emission factors fill the gap without breaking the model.
Built for scale, not a single site
02

One methodology, deployed consistently across every member site, business unit, and brand.

A single data model and methodology rolls out across dozens or hundreds of member sites and multiple downstream brands, without requiring every entity to hit the same IT maturity or wait for a central mandate before starting. New sites and new data sources plug into the same framework as they come online.
Comparable, credible, and built for what's next
03

Granular enough to reflect real farm differences, and defensible enough to survive scrutiny.

34,000+ food-specific emission factors let the platform model what's actually happening on each farm, not a blended average. That's what makes the number hold up when a retailer, auditor, or brand pushes back on it, not a proxy that falls apart under scrutiny.
forest, land and agriculture emissions
04

FLAG emissions handled properly

Every emission factor, source, and methodology choice is documented and traceable, not a black box. This matters most for FLAG and land-use emissions, the category most tools get wrong. Aligned with CSRD, SBTi, and the GHG Protocol, independently validated by TÜV Rheinland and Bureau Veritas.
the platform

One platform, from the member farm to the group-wide inventory.

Covering measurement, member-farmer data collection, and the product-level footprints that feed every brand the cooperative sells under.
One Group-Wide Inventory

Bring every entity, brand, and IT system into one inventory, instead of a patchwork of local reports.

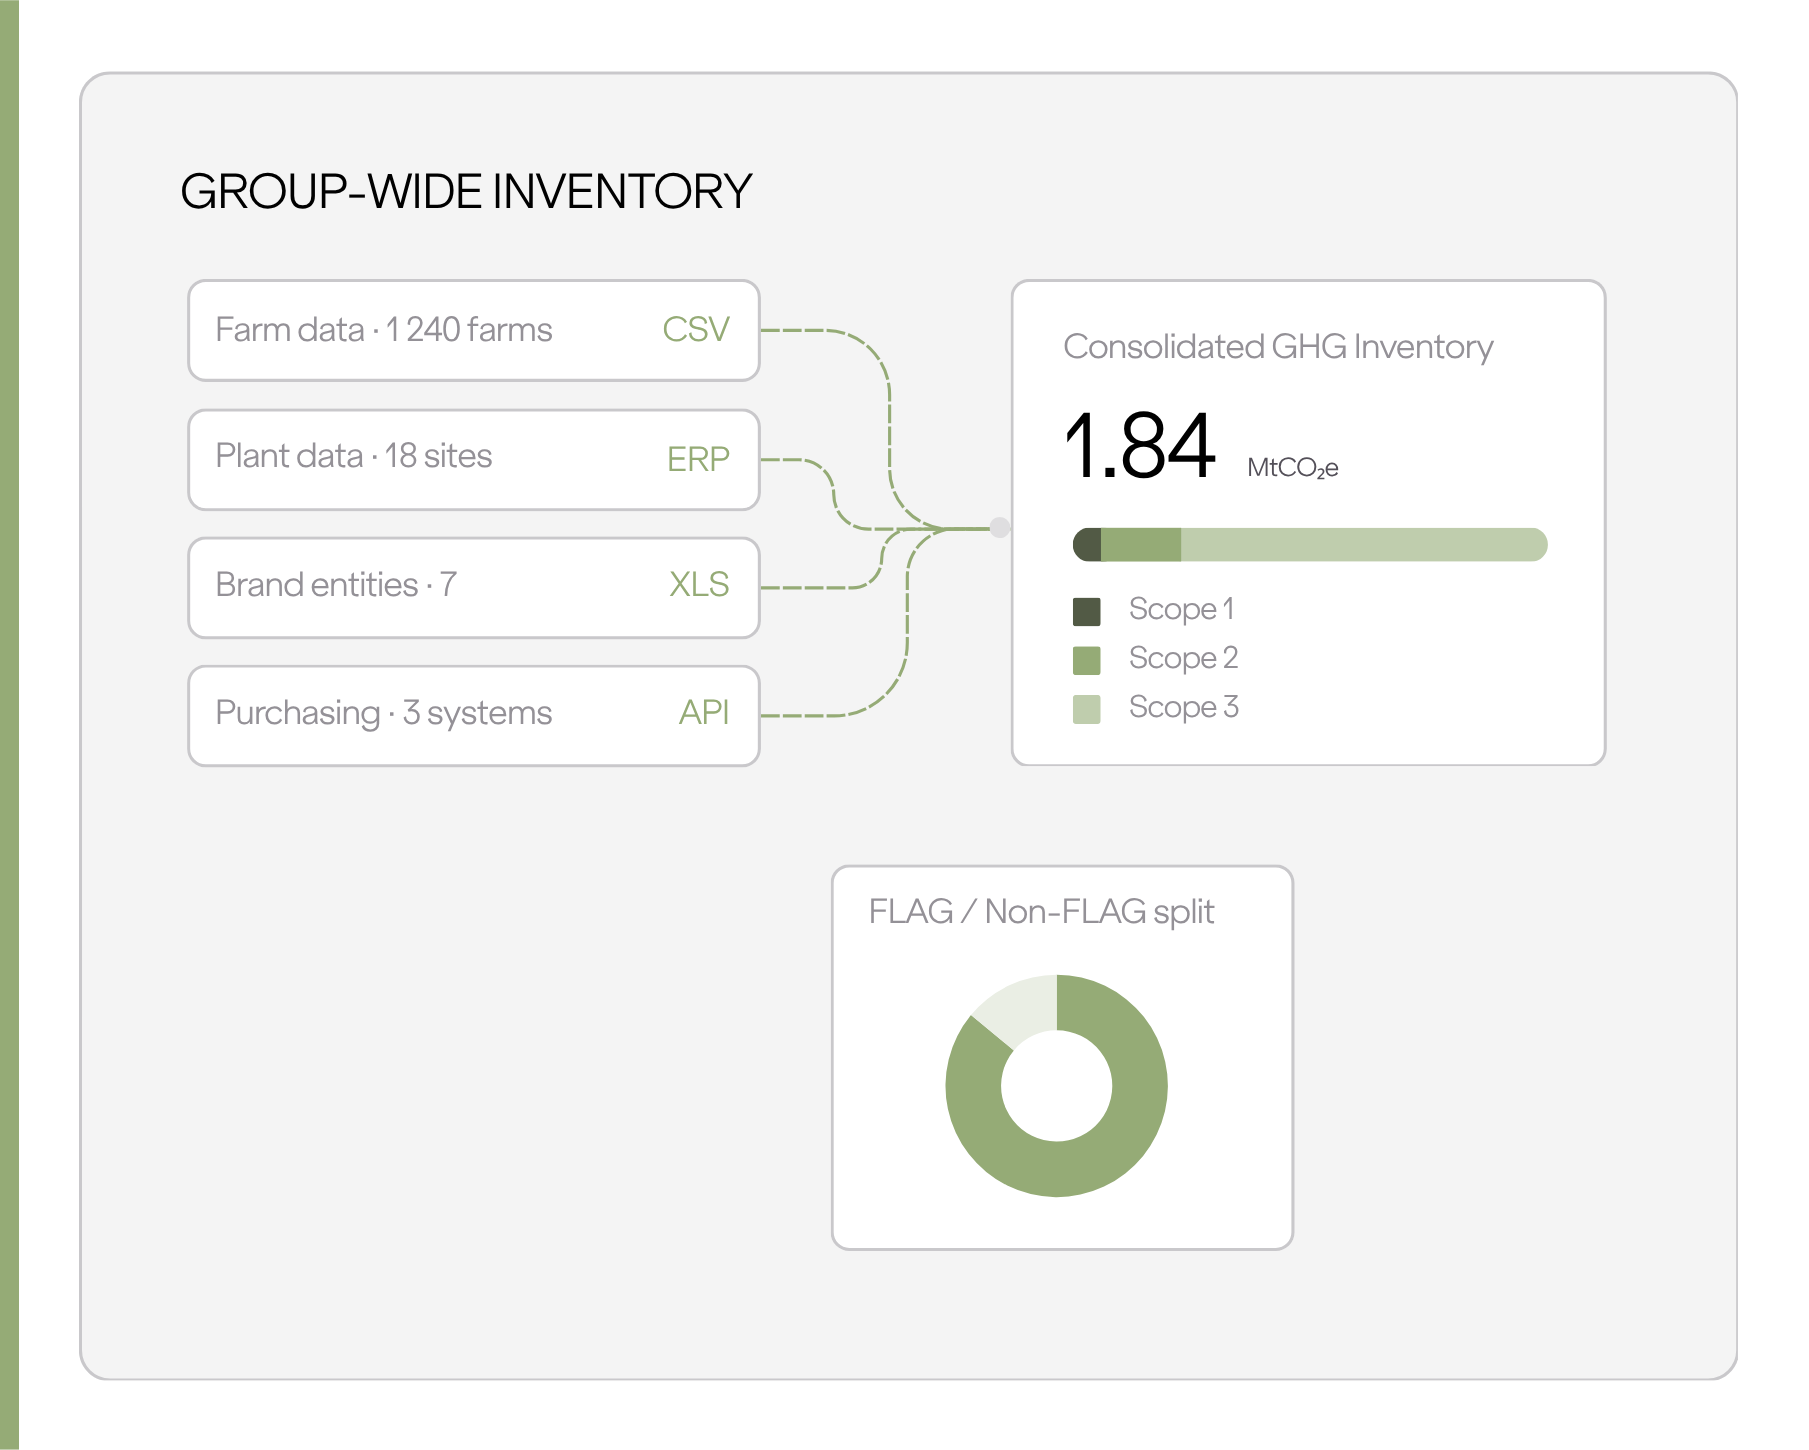
Farm data, plant data, and whatever systems each entity runs, reconciled into one Scope 1, 2 & 3 inventory.
One consolidated GHG inventory covering every entity and brand in the cooperative, no matter how many systems the data comes from
Raw agricultural inputs modelled at the farm and product level, not estimated from spend
Land-use and livestock emissions (FLAG) treated as a first-class category, not an afterthought
Results that hold up against CSRD/ESRS E1, the GHG Protocol, and SBTi, whoever's checking
Every Brand, Every Harvest, One Footprint

Keep every downstream brand's footprint accurate, season after season, not just at launch.

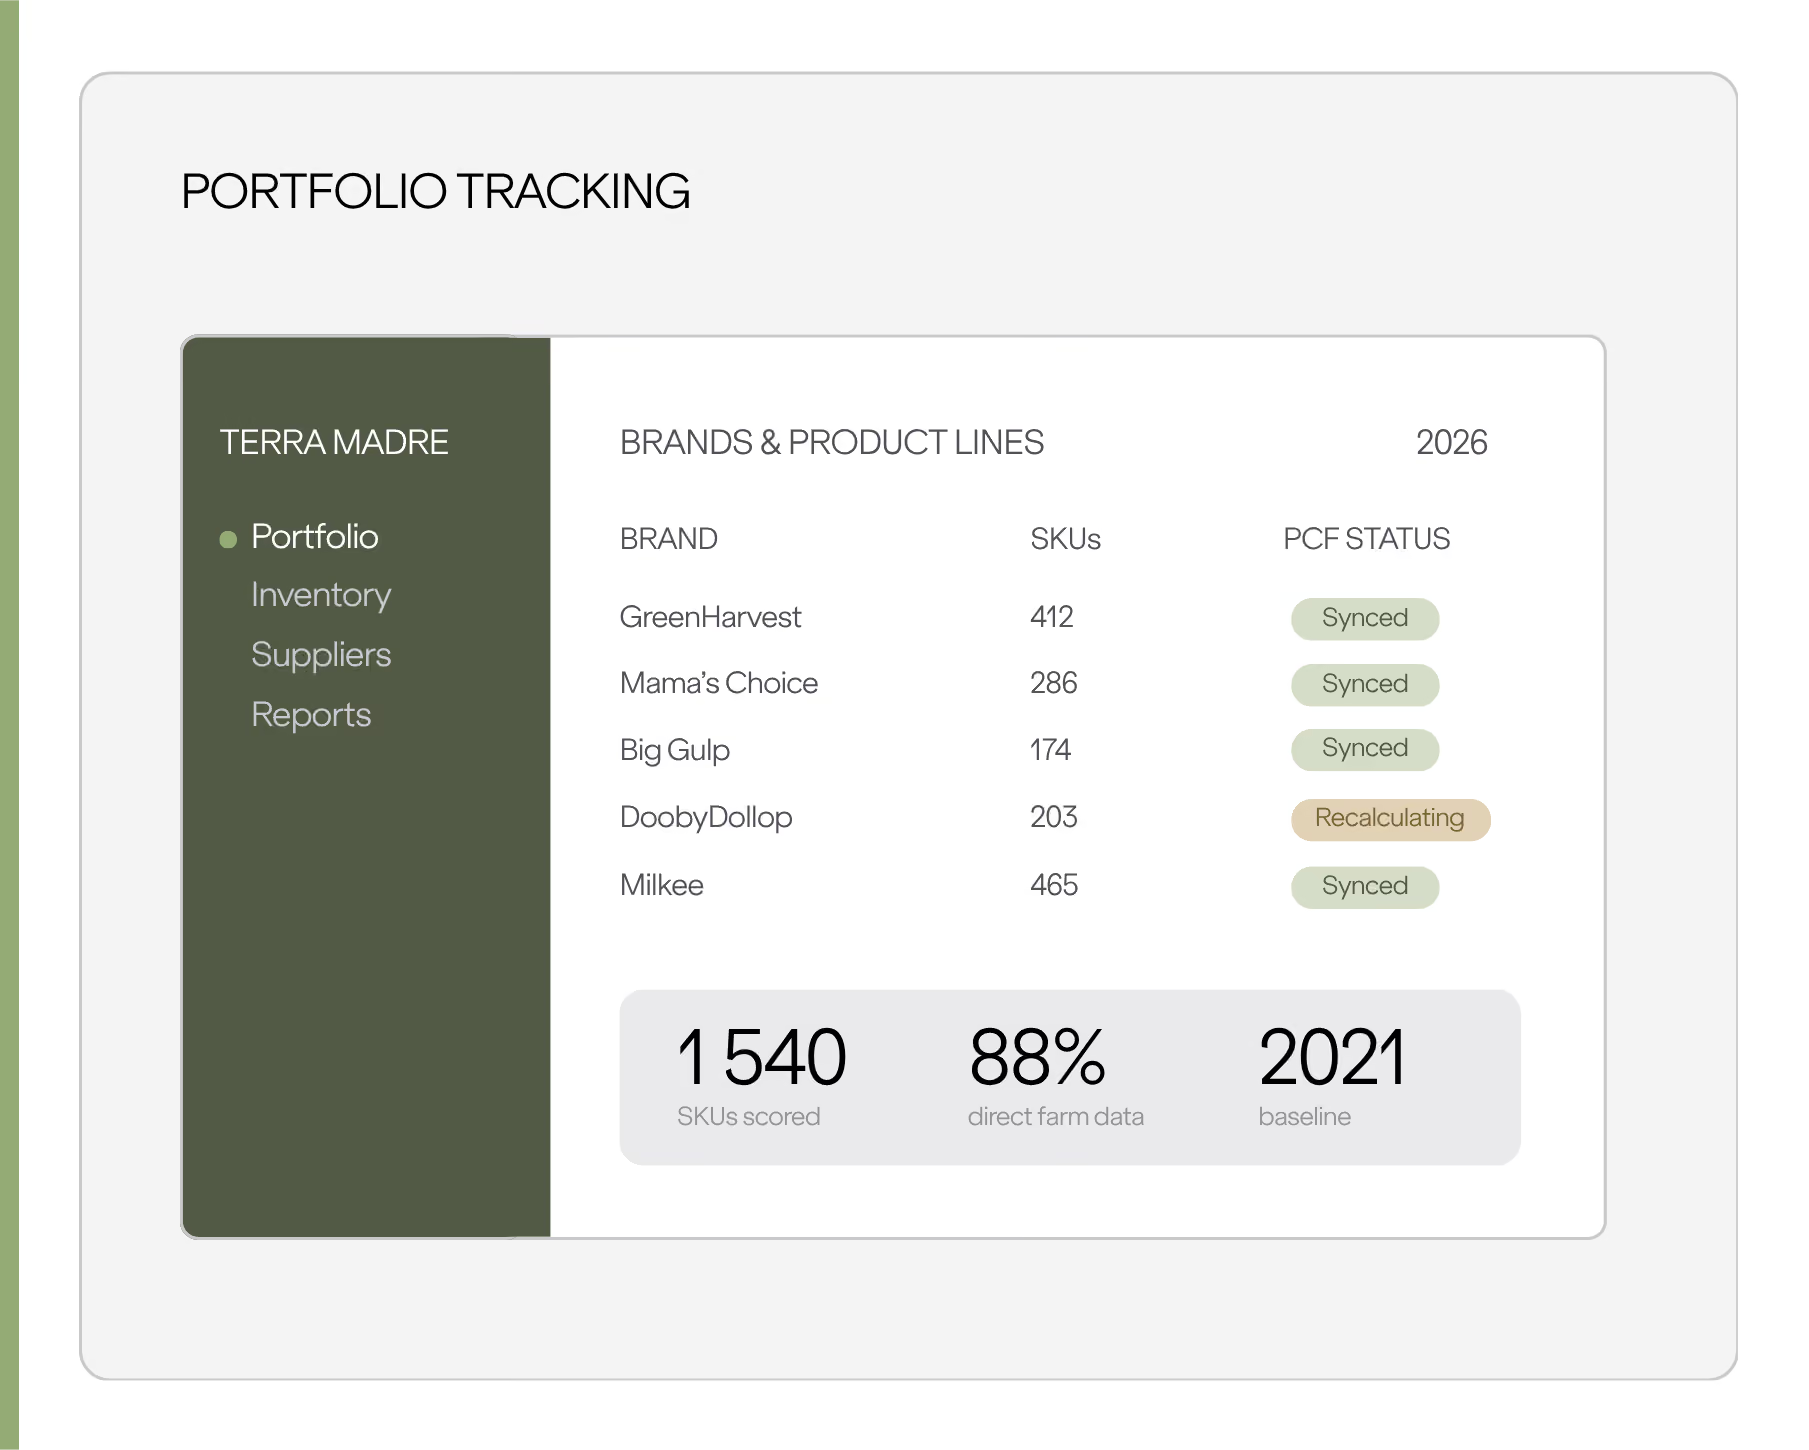
Thousands of product references, tracked consistently as harvests, suppliers, and methodology all keep changing.
Ingredient-level PCFs and LCAs generated automatically for every brand and product line the cooperative supplies
Gaps in farm-level data get filled by food-specific emission factors, not left as a blank or a guess
Methodology or emission-factor updates get locked to a baseline year, so a real reduction never gets confused with a change in how it's counted
New farm or site data updates every product it touches automatically, instead of triggering a full manual re-run
customer stories

Turning farm data into consolidated footprints.

14,500+ member farmers, 7 business units, one group-wide datahub instead of another isolated tool.

France's largest dairy cooperative, and Europe's third-largest, spans 14,500+ member farmers and flagship brands including Candia, Yoplait, and Entremont, across 7 business units and 50+ web entities. Environmental data was scattered across disconnected IT systems, so SODIAAL's Sustainability and IT teams worked with Carbon Maps to plug product-level footprints directly into their existing Datahub and PLM processes, rather than bolt on another isolated tool.

The result: a CSR team that shifted from consolidating spreadsheets by hand to acting on product-level data embedded directly in New Product Development.

A 673-farm dairy producer organization, already running its own low-carbon milk program, now tracking its carbon trajectory farm by farm.

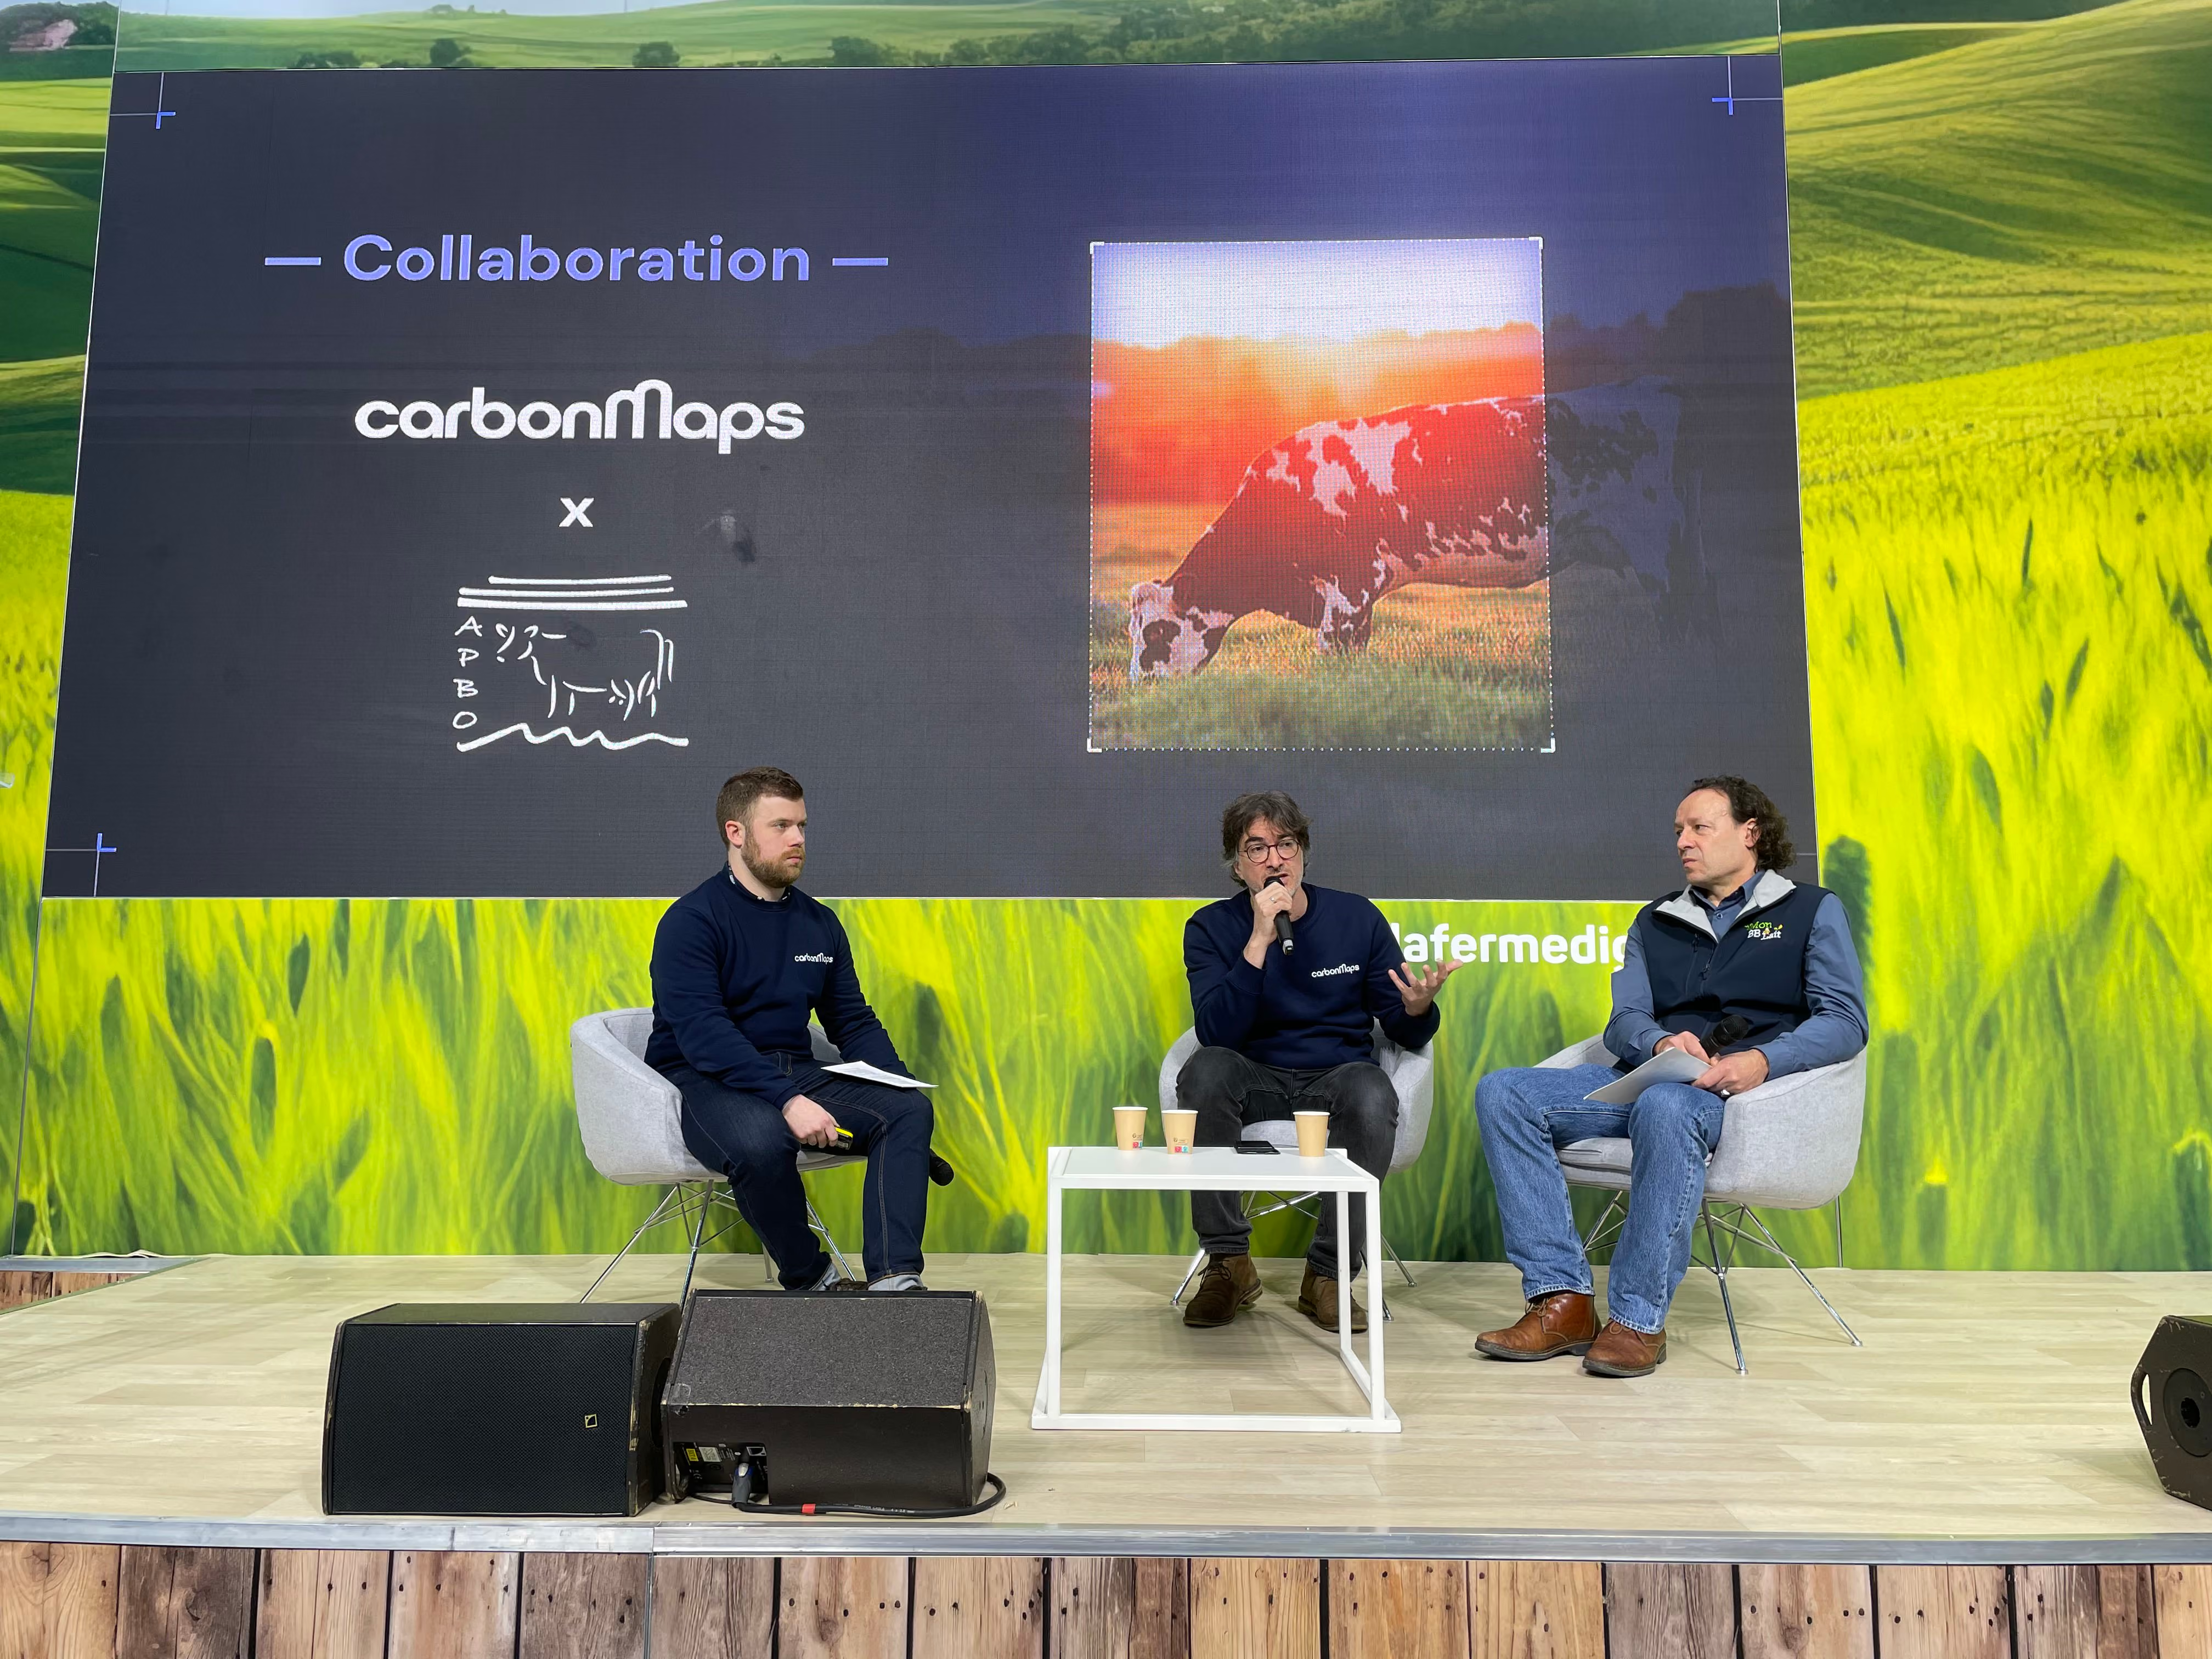
APBO, one of the first producer organizations recognized in France's dairy sector, represents 673 member farms and around 1,100 farm managers across six departments in western France, delivering 410+ million litres of milk a year to Fromageries Bel. Through its own low-carbon dairy program, Mon BB Lait®, APBO had already built a shared framework for fairer producer pay and verified farming practices.

Carbon Maps software connected that framework to real emissions data collected via the CAP2ER and Cool Farm Tool APIs, giving APBO a shared carbon trajectory for its milk and one consolidated report the whole organization can stand behind.
FAQ

What cooperatives ask before scaling farm data into one footprint.

The practical questions about member-farm data, FLAG emissions, and group-wide methodology that come up most.
How can a cooperative collect emissions data from thousands of member farmers at scale?
+
One spreadsheet and one specialist can't scale past a few hundred product references. It doesn't matter how rigorous the calculations are. Carbon Maps replaces that bottleneck with structured digital workflows that let non-expert teams, agronomists, procurement, quality, feed data in directly, so collection scales with the size of the membership instead of with one person's bandwidth.
How do cooperatives reconcile the same farm-level data with different footprint requirements across brands or clients?
+
The same farm-level dataset often needs to produce different results depending on who's asking: one brand wants mass allocation, another wants economic, a certifier wants a specific standard entirely. Carbon Maps keeps one underlying data model per farm and product, then applies the allocation and methodology each brand or client requires on top of it, so cooperatives aren't re-collecting data or maintaining parallel spreadsheets for every downstream requirement.
Why do FLAG and land-use emissions matter so much for cooperatives specifically?
+
For most cooperatives, the FLAG and land-use share of a product's footprint outweighs everything happening inside their own plants, which is why a credible product carbon footprint today is expected to break out FLAG from non-FLAG explicitly, not bundle it into one number. Generic carbon tools are typically built around industrial processes and struggle with this category, which is exactly where Carbon Maps builds in dedicated FLAG treatment from the start.
Can several independent business units or member sites share one common methodology?
+
Independent business units and member sites can share one common methodology even when they've grown up with different calculation approaches and different decarbonization timelines, especially while sustainability governance is still being centralized. Carbon Maps rolls out a single data model and methodology across as many business units, sites, and brands as a cooperative operates, letting each one plug in on its own timeline instead of waiting for every entity to standardize first.
Is Carbon Maps data audit-ready for CSRD and SBTi FLAG reporting?
+
Carbon Maps data is audit-ready for CSRD and SBTi FLAG reporting. Outputs align with CSRD/ESRS E1, the GHG Protocol, and SBTi, with dedicated FLAG treatment for the land-sector and livestock emissions that dominate a cooperative's footprint. The methodology is independently certified against the PACT Methodology V3 by TÜV Rheinland and validated by Bureau Veritas against ISO 14040, 14044, and 14067.

Further reading

Go deeper on FLAG and land-use emissions, the category that dominates a cooperative's footprint.
Blog Image

SBTi Net-Zero Standard V2.0 is Final: What Changed Since the November 2025 Draft

Read
arrow forward
Blog Image

EUDR & SBTi: How Carbon Maps Helps Food & Beverage Brands Comply With Both

Read
arrow forward
Blog Image

What’s New in the SBTi Net-Zero Standard V2: November 2025 Update Explained

Read
arrow forward
CLIENT QUOTE

Through Carbon Maps’ expertise and the power of their platform, we uncovered a significant 30% reduction opportunity in our most emissions-intensive product categories. This achievement underscores the impact of precise data analysis and collaboration with our suppliers.

name