Leafy greens and vegetables in baskets in rows
retailers

The Scope 3 platform built for food retailers

Turn supplier and private-label data into emissions visibility your buying teams can act on and reporting your stakeholders can trust.
the challenge

Your biggest emissions lever sits with suppliers you can't get data from.

Around 90% of a food retailer's footprint sits in the supply chain and the hardest part to move is Scope 3.1: primary carbon data from the branded suppliers behind your shelves.
Even those with public climate targets rarely share product-level footprints, and chasing them one template at a time doesn't scale.
So teams fall back on generic averages that hide real reduction work, or data too stale to be useful by the time procurement sees it, while SBTi pathways stall, CSRD audits loom, and competitors publish environmental scores on shelf.
Why Carbon Maps

Emissions data your buyers can act on and your auditors can trust.

Not a generalist carbon tool pointed at grocery retail. A platform built on food-industry data and the structure of a retail supply chain, from private-label range to branded supplier network.
Primary data from branded suppliers, at scale
01

Replace the manual template chase with a real collection engine.

Structured, automated workflows collect product-level footprints from your entire supplier base, including the large branded suppliers who already have climate targets but rarely share PCFs. Move past a handful of SKUs to portfolio-wide primary data.
Data current and granular enough for procurement
02

Carbon that reaches the buying team while the decision is still live.

Ingredient- and supplier-level modelling shows which sourcing choices actually move the number and surfaces the impact of supplier reduction work that generic averages hide. Fresh enough, and specific enough, to sit inside a procurement scorecard rather than an 18-month-old report.
Comparable, credible, and built for what's next
03

The same product shouldn't yield a different footprint depending on who calculates it.

A consistent, food-specific methodology using 34,000+ emission factors, gives you PCFs you can defend and compare across products and suppliers. Certified compliant with the PACT Methodology V3 as it consolidates into the industry standard, so today's data holds its value.
Audit-proof and standards-aligned
04

Reporting that stands up when it's assured and when FLAG gets hard.

Every emission factor, source, and methodology choice is documented and traceable, aligned with CSRD, SBTi, and GHG Protocol, with dedicated handling for FLAG and land-sector emissions that trip up generalist tools. Independently validated by TÜV Rheinland (PACT V3, under ISO 14064-3) and by Bureau Veritas (ISO 14040/44/067).
the platform

Three ways retailers put carbon data to work.

One platform covering the measurement, the supplier data behind it, and the shelf-facing scores in front of it.
Global corporate emissions

Ground your Scope 3 inventory in real products, not spend estimates.

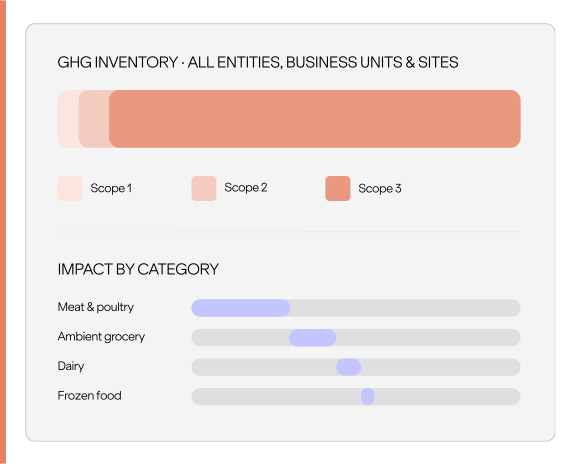
Your full Scope 1, 2 & 3 inventory with the supply chain that dominates it modelled properly.
A minimalist, ultra-thin line art icon to represent a check mark.
One consistent inventory across every entity, banner, and site — a single carbon layer for a multi-format group, not one tool per subsidiary.
A minimalist, ultra-thin line art icon to represent a check mark.
Purchased goods modelled at product and supplier level, not estimated from spend so the 90% upstream is grounded in your actual assortment
A minimalist, ultra-thin line art icon to represent a check mark.
Audit-ready outputs aligned with CSRD/ESRS E1, GHG Protocol, and SBTi
A minimalist, ultra-thin line art icon to represent a check mark.
FLAG treatment for land-sector emissions built in
PCF and lca at scale

Footprint your entire private-label range, SKU by SKU.

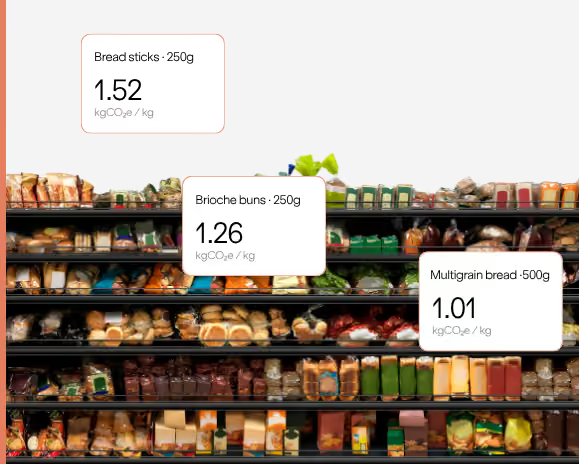
Auditable PCFs and LCAs across your entire private-label range for thousands of SKUs, not just a pilot handful.
A minimalist, ultra-thin line art icon to represent a check mark.
Automated, ingredient-level PCFs and LCAs across your own-brand portfolio
A minimalist, ultra-thin line art icon to represent a check mark.
Food-specific engine matches the right emission factors even where supplier data is partial or missing
A minimalist, ultra-thin line art icon to represent a check mark.
New supplier primary data flows through ensuring every affected product updates automatically
A minimalist, ultra-thin line art icon to represent a check mark.
Methodology certified against PACT V3 (TÜV Rheinland) and validated by Bureau Veritas, so footprints stay comparable and defensible under scrutiny
A minimalist, ultra-thin line art icon to represent a check mark.
Model reformulation and sourcing trade-offs before you commit; see the footprint impact of an ingredient or supplier switch.
supplier engagement

Get primary data from the branded suppliers behind your shelves.

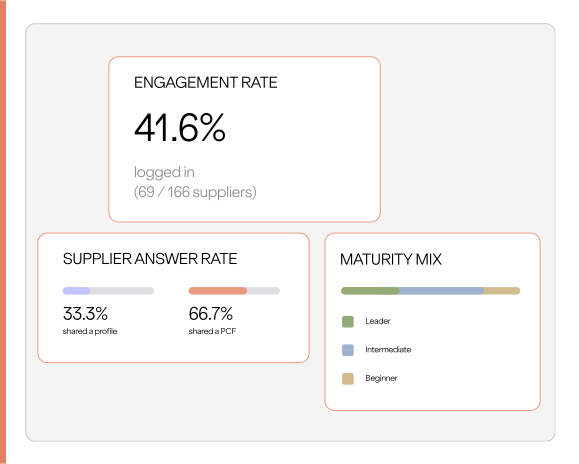
Turn the manual template chase into primary data from the brands behind your shelves.
A minimalist, ultra-thin line art icon to represent a check mark.
Structured workflows across primary data collection, ESG maturity assessment, and PCF validation
A minimalist, ultra-thin line art icon to represent a check mark.
Built for the scale of a retail supplier base, not one spreadsheet at a time
A minimalist, ultra-thin line art icon to represent a check mark.
Get product-level footprints from large branded suppliers
A minimalist, ultra-thin line art icon to represent a check mark.
Replace the generic averages that hide suppliers' reduction work and feed carbon into procurement while the sourcing decision is still open
A minimalist, ultra-thin line art icon to represent a check mark.
One structured request replacing the overlapping questionnaires suppliers already field from every retailer they serve.
customer stories

Retailers already turning supplier data into decisions.

Product-level footprints across 6,000 own-brand references

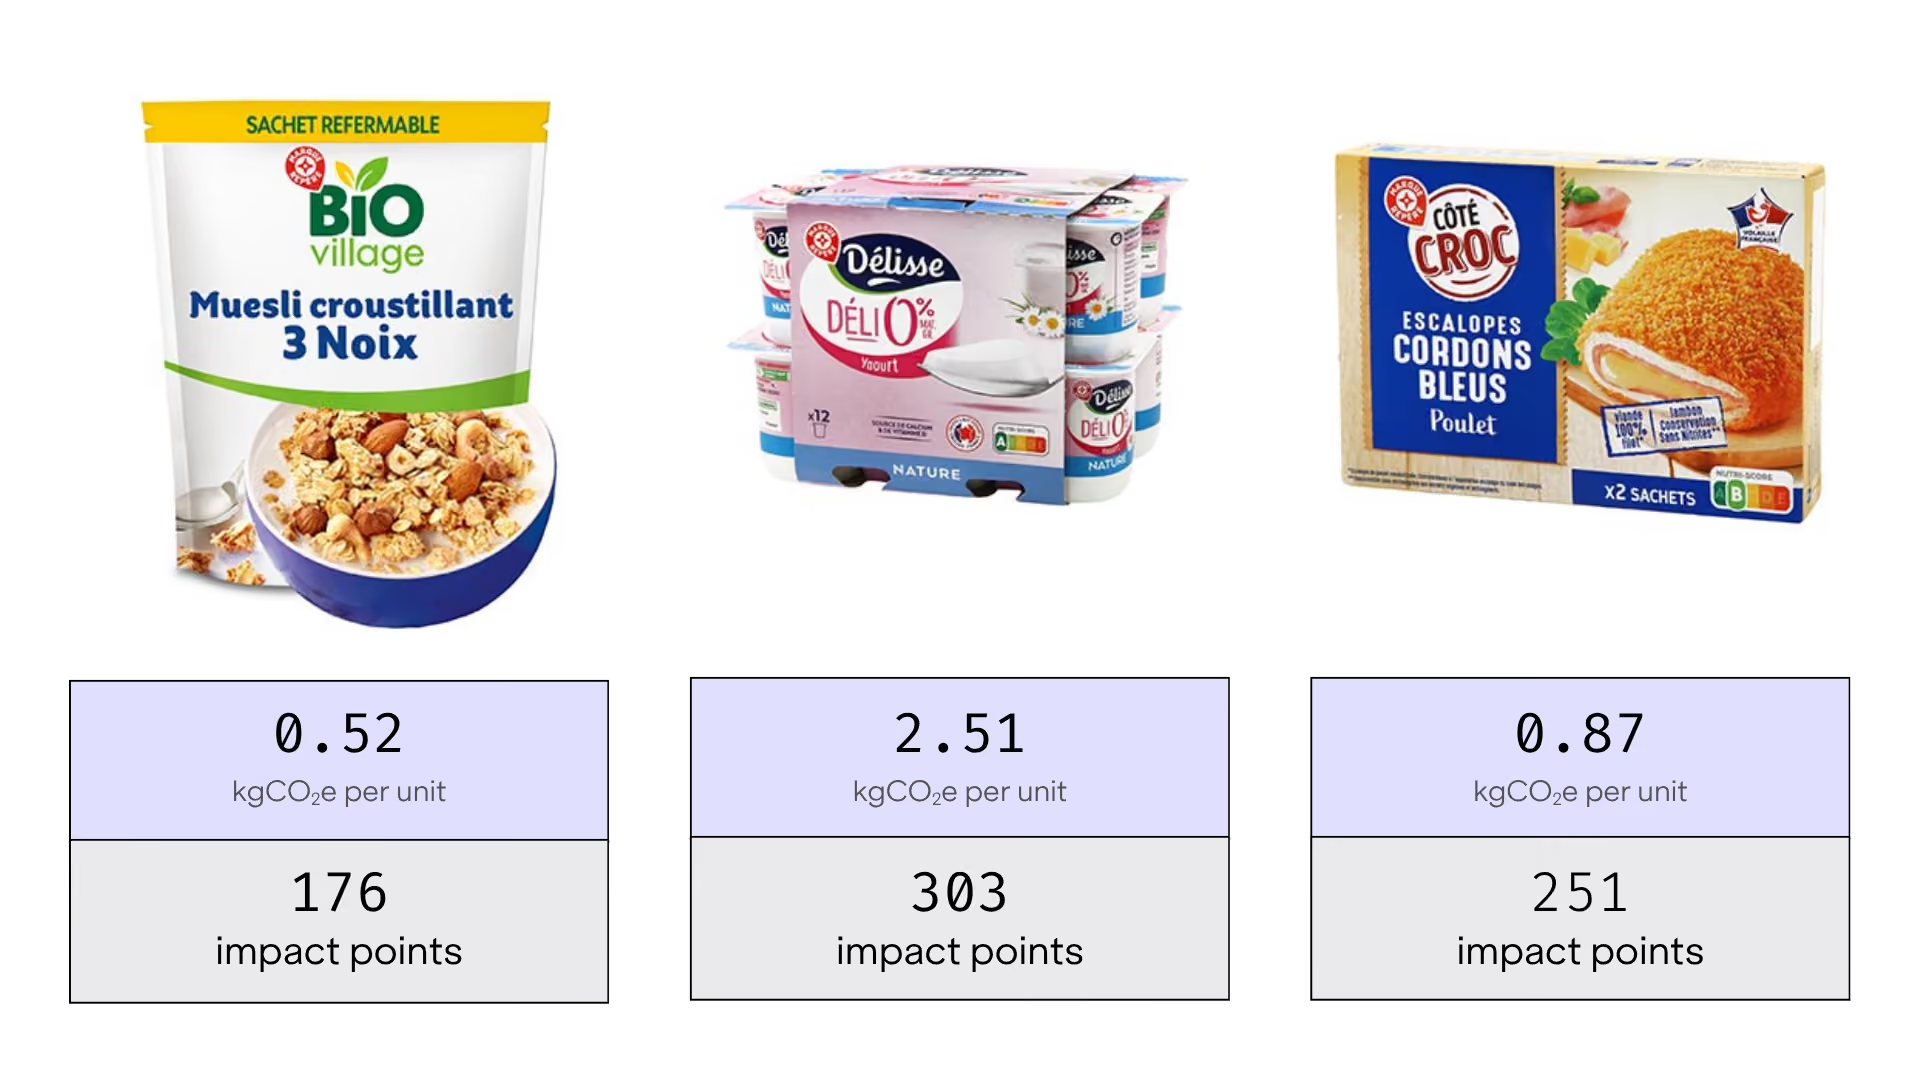
Scamark, the entity behind E. Leclerc's private label, worked with Carbon Maps to model the environmental impact of its entire own-brand range — 6,000 products — building the recipe modelling and supply-chain data foundation that now powers consumer-facing transparency and makes E. Leclerc the first French retailer to score its catalogue at scale.

From spreadsheets to a living Scope 3 view across 200,000 SKUs.

One of France's largest grocery retailers — 1,800+ stores, with an SBTi-validated reduction pathway and 90%+ of emissions in Scope 3 — replaced months-long spreadsheet exercises with product-level footprints across its full assortment.

The result: buyers, quality engineers, and CSR teams now spot hotspots by category and supplier and use the data in daily buying, not just annual reporting.

Where private-label decarbonization actually happens: in the recipe.

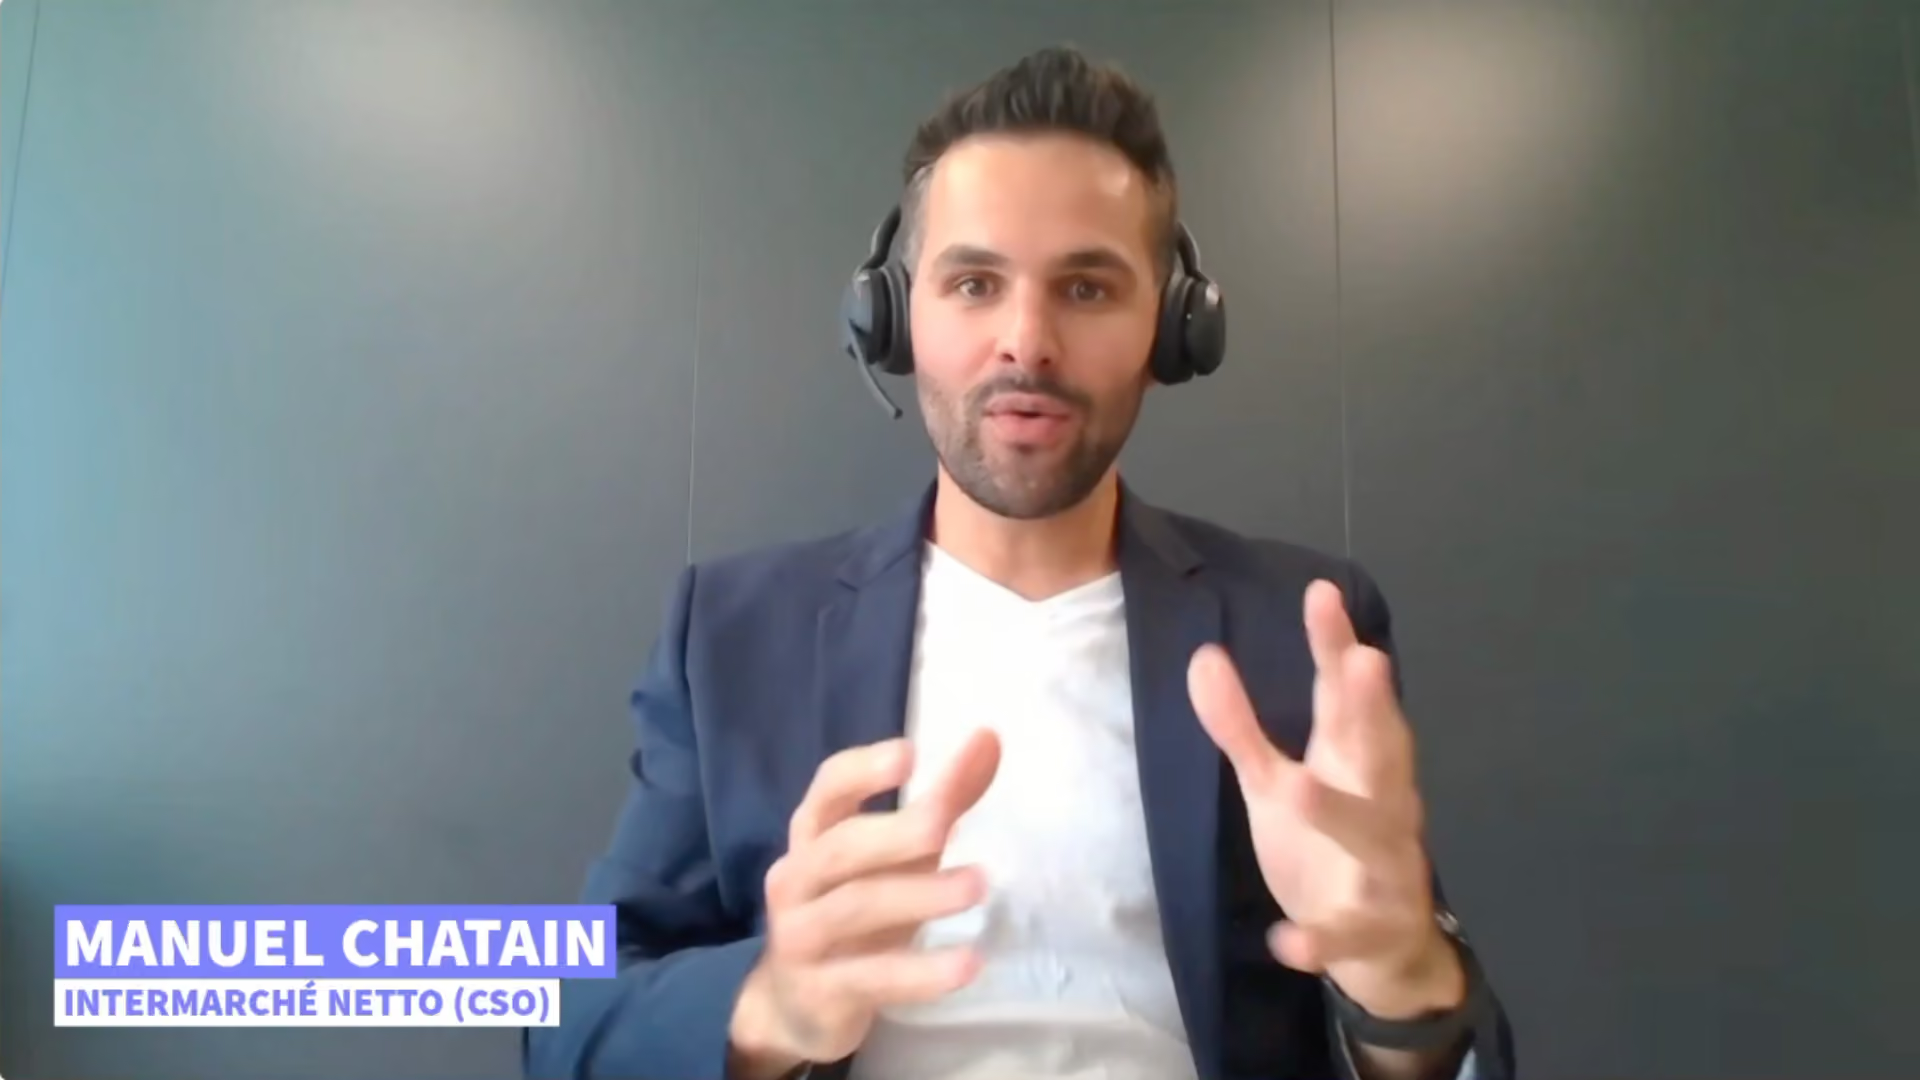
Intermarché is the only European retailer that's also a producer — 15+ factories making around 40% of its own private-label products.

In this short clip, Manuel Chatain explains how they measure the carbon footprint of each private-label product in Carbon Maps, pinpoint the biggest emission sources in a recipe, then work with R&D to reformulate ingredients and sourcing for a lower-footprint product, building carbon into product design from conception.
FAQ

What retailers ask before choosing a platform.

The practical questions behind measuring Scope 3 at retail scale.
How do retailers measure Scope 3 emissions with granularity?
+
Retailers can measure Scope 3 emissions at a granular level by modelling emissions at the product and supplier level. This means using real recipes and primary supplier data instead of spend-based estimates, which don't reflect a product's actual footprint. Product-level modelling is what makes Scope 3 data usable for buying decisions, not just reporting.
How can retailers collect carbon data from branded suppliers at scale?
+
Retailers can collect carbon data from branded suppliers at scale using structured supplier-engagement workflows rather than emailed spreadsheets or templates. Carbon Maps collects primary data, assesses supplier maturity, and validates submitted product carbon footprints across the entire supplier base. This approach lets retailers get real product-level footprints even from large branded suppliers that rarely share data on request.
Is Carbon Maps data audit-ready for CSRD and SBTi reporting?
+
Carbon Maps data is audit-ready for CSRD and SBTi reporting. Outputs align with CSRD/ESRS E1, the GHG Protocol, and SBTi, and include FLAG treatment for land-sector emissions that dominate food footprints. The methodology is independently certified against the PACT Methodology V3 by TÜV Rheinland and validated by Bureau Veritas against ISO 14040, 14044, and 14067.
Can retailers compare carbon footprints across suppliers and products?
+
Retailers can compare carbon footprints across suppliers and products when every footprint is calculated with one consistent, food-specific methodology. A shared methodology means the same product won't return a different footprint by chance, which makes PCFs comparable across a retailer's range. Comparable footprints are also more defensible when a supplier or auditor questions the numbers.
Can procurement teams use carbon data in buying decisions?
+
Procurement teams can use carbon data in buying decisions when the data is granular and current enough to act on. Product-level footprints let buyers factor carbon into sourcing while the decision is still open, rather than waiting on a report that is 18 months out of date. This turns carbon data into a procurement input instead of a reporting exercise.
Does Carbon Maps replace our existing supplier data platform?
+
No. Carbon Maps works alongside the supplier and product-data systems retailers already use, drawing on primary data wherever it lives and standardising it into one comparable methodology. The goal is one consistent carbon layer across your sources, not another system to migrate to.

Further reading

Read about how leading food retailers replace spreadsheets and generic averages with primary, product-level carbon data at scale.
Blog Image

How Carbon Maps Helps Coopérative U Turn Scope 3 Insight into Daily Action

Read
arrow forward
Blog Image

Driving Emission Reductions in Bottled Water with Data-Driven PCFs

Read
arrow forward
Blog Image

Solinest Streamlines their Supplier Sustainability Assessments with Carbon Maps

Read
arrow forward