CORPORATE

Carbon accounting built for agricultural supply chains.

Most carbon accounting platforms stop at spend-based estimates. Carbon Maps traces emissions back to the farming practices, origins, and suppliers that drive them.
the challenge

Companies are under more disclosure pressure than ever.

For food companies, corporate carbon accounting is only as good as its Scope 3.
As CSRD, SBTi, and CDP raise the bar on traceability and third-party assurance, a corporate carbon footprint built on category averages is becoming a liability, not a baseline.
90%
of food-industry emissions sit in upstream operations within Scope 3
1M+
data points to collect, validate and calculate across a typical enterprise food company's value chain
Why Carbon Maps

Depth that generalist platforms can't match.

Not a generic carbon accounting tool with a food filter. A platform built from the ground up on food-industry data, methodology, and supply-chain structure.
01 - Ingredient-level Scope 3.1
Modeled from the recipe up, not estimated from spend.
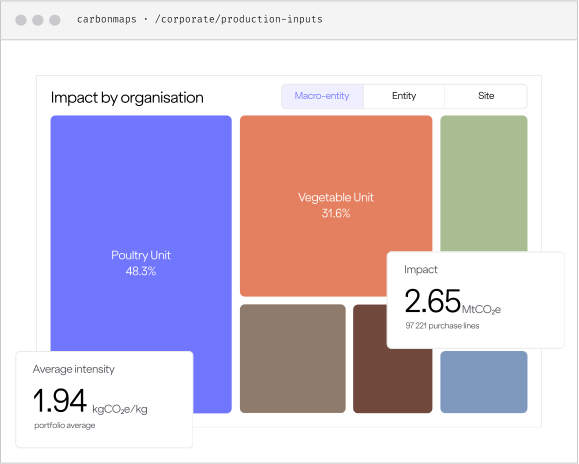
Most platforms multiply spend by an emission factor and move on. Carbon Maps models Scope 3.1 from the ingredient and stage level, so your largest emissions category is grounded in your actual supply chain, not a commodity average.
02 - Built for enterprise
The organisational complexity of a food group, handled.
Multi-entity, multi-site, multi-BU consolidation with role-based workflows and built-in reconciliation across scopes and entities. Built for the way large food businesses actually operate.
03 - Audit-ready by design
Every modelling choice documented, traceable, and defensible.
Every emission factor, data source, and methodology decision is recorded and auditable, aligned with GHG Protocol, SBTi FLAG, and CSRD disclosure requirements.
The platform

Everthing your corporate carbon footprint requires, in one platform.

01 · Data collection
Get the right data in, without the manual chase.
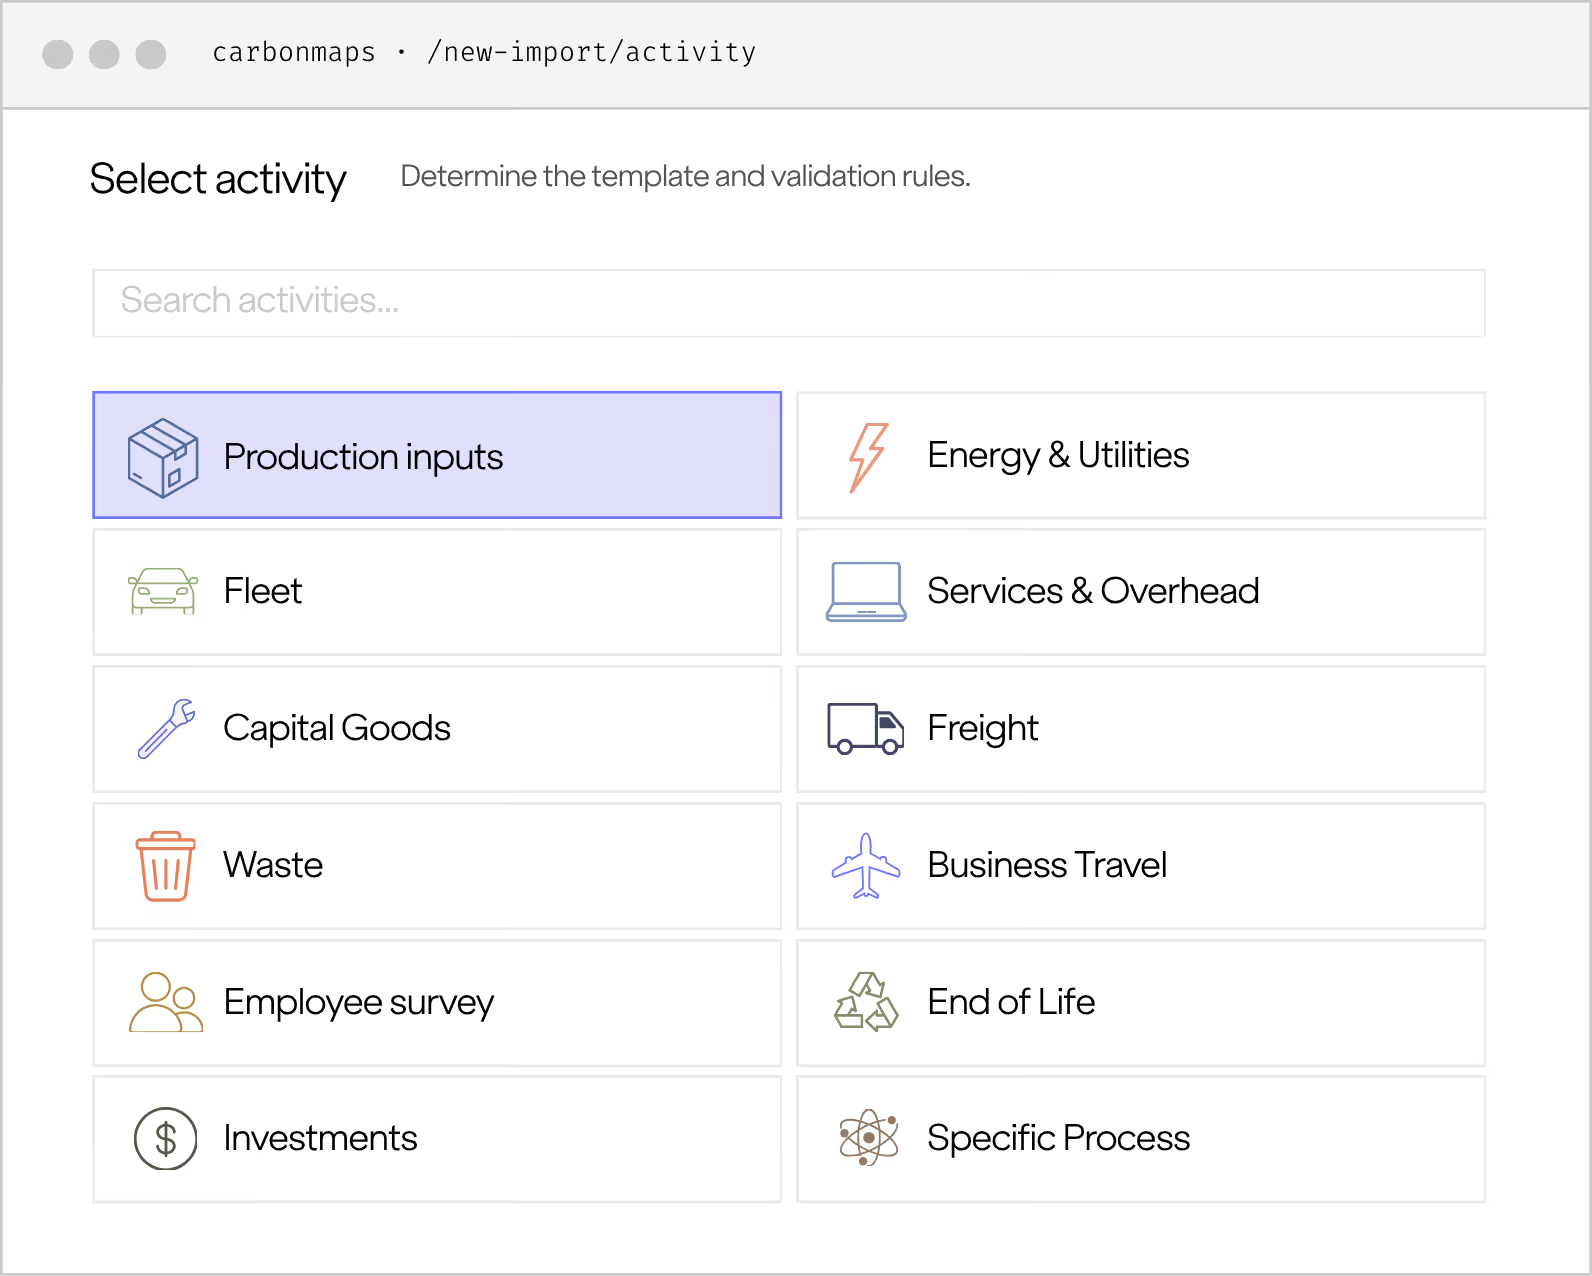
Customisable ingestion templates, native ERP and procurement connectors, and contributor workflows that distribute the data collection work across your organisation.
Native ERP, accounting, and procurement connectors with full API access
Customisable ingestion templates adapted to your data structure
Real-time progress tracking, task allocation, and completion KPIs across contributors
Role-based access for contributors, reviewers, and validators across entities and sites
02 · calculation
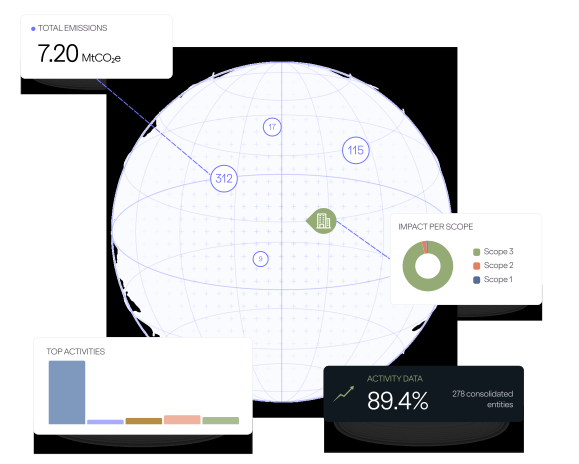
Full Scope 1, 2 and 3 calculation across your entire organisation.
A calculation engine that handles the full GHG inventory, with methodology-correct workflows for each category and built-in reconciliation across scopes and entities.
Purpose-built workflows per GHG category, not a generic data entry form
Covers all 15 Scope 3 categories, with activity-based modeling where spend-based estimates fall short
Built-in double-counting detection and cross-scope, cross-entity reconciliation
Multi-entity, multi-site, multi-BU consolidation with reporting at any level: site, BU, country, product line, group
03 · Disclosures & reporting
Audit-ready output across every major framework.
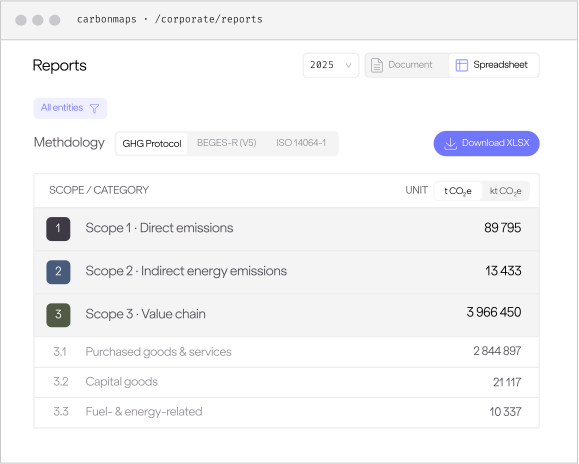
Every calculation documented and traceable, with multi-methodology exports structured for the frameworks your stakeholders require.
BEGES, GHG Protocol, CSRD/ESRS E1, CDP, TCFD, GRI, SBTi
Audit-ready exports with traceable calculations for third-party assurance
Version control capturing changes between reporting periods and why
See our guide to CSRD compliance for Food & Beverage →
Trust & compliance

Your corporate footprint, built on internationally recognised standards.

CSRD
European Sustainability Reporting Standards (ESRS E1) and IFRS S2 developed by the International Sustainability Disclosure Standards (ISSB)
ISO 14064-1
International standards for organisation-level emissions reporting
GHG Protocol
Corporate Accounting and Reporting Standard for Scope 1 and 2 and the Corporate Value Chain for Scope 3
Bilan Carbone®
The gold-standard operational methodology in France
Frequently asked questions

What to know about carbon accounting for food companies

Practical answers to the questions that come up most when food companies start their carbon accounting journey.
Why is corporate carbon footprinting more complex for food companies than for other industries?
+
For most food companies, 80–90% of emissions sit in Scope 3, primarily in purchased agricultural goods. Unlike energy or transport emissions, agricultural supply-chain emissions vary dramatically by origin, farming practice, and processing method. Generic carbon accounting tools handle energy and facilities data well. They struggle with the ingredient-level complexity that makes up the majority of a food company's footprint.
What's the difference between spend-based and activity-based Scope 3 calculation, and does it matter for CSRD?
+
Spend-based calculation multiplies procurement spend by an industry-average emission factor. It's fast to implement but produces results too coarse to identify which suppliers or ingredients drive emissions, and too generic to hold up under CSRD's traceability and assurance requirements. Activity-based calculation models actual quantities, origins, and production methods. It takes more effort to set up, but produces results specific enough to inform sourcing decisions and survive external review.
Does Carbon Maps' corporate carbon footprint cover all 15 Scope 3 categories?
+
Yes. Carbon Maps covers all 15 Scope 3 categories defined by the GHG Protocol, with purpose-built workflows for each category. For food companies, particular depth is applied to Category 1 (purchased goods and services), where ingredient-level modeling replaces spend-based estimates.
How does Carbon Maps handle SBTi FLAG requirements within a corporate carbon footprint?
+
FLAG (Forest, Land and Agriculture) guidance requires food companies to separate land-use and agricultural emissions from fossil fuel emissions when setting science-based targets. Carbon Maps' methodology is aligned with SBTi FLAG guidance, so your corporate footprint is structured to support both target-setting and progress tracking under the FLAG framework from the outset.
How does the corporate carbon footprint connect to product carbon footprints in Carbon Maps?
+
In Carbon Maps, the corporate and product layers share the same underlying data model. Scope 3.1 emissions in your corporate footprint draw directly from the ingredient-level data that powers your product carbon footprints, eliminating double entry and ensuring the two inventories stay consistent. When product-level data updates, your corporate footprint updates with it.

Understand what good looks like in practice.

Blog Image

Scope 3 Emissions: A Complete Guide to the 15 Categories

Read
arrow forward
Blog Image

How to Build a Regulator-Proof Corporate Carbon Footprint

Read
arrow forward
Blog Image

Best Carbon Accounting Software by Industry-2026 Guide

Read
arrow forward