Canned food in purple, blue, and yellow rows on shelfs
manufacturers and brands

Know the environmental footprint of every product you make

Modeled from your actual recipes, ingredients, and packaging, not industry averages, so the numbers hold up with retailers, auditors, and regulators.
the challenge

You know the impact is in the recipe. Proving it is the hard part.

Most food manufacturers can't model the carbon impact of a reformulation without a multi-week project. Ingredient and packaging data sits scattered across regional ERPs and PLMs, often under names that don't match from one system to the next.
Generic emission factor databases make it worse: built for raw agricultural commodities, not the processed, blended products manufacturers actually sell. Teams end up building one-off models or relying on proxies that don't survive scrutiny.
Retailers, SBTi FLAG, and CSRD auditors now all demand the same thing: precise, documented, product-level carbon data.
Why Carbon Maps

Your ingredient data is scattered across systems. Your footprint doesn't have to be.

Carbon Maps models a formulation the way it's actually built: ingredient by ingredient, process step by process step.
One data model, however many systems your data lives in
01

Reconcile the recipe before you try to measure it.

Ingredient and material names rarely match across a global brand portfolio, each site and system tends to have its own naming conventions. Carbon Maps ingests material and recipe data straight from your ERP, PLM, and regional systems and reconciles it into one consistent model, so a multi-brand, multi-site manufacturer isn't rebuilding the mapping by hand every time a new site or acquisition comes online.
Emission factors built for what you actually process
02

Model the product you make, not its nearest raw ingredient.

34,000+ food-specific emission factors cover the transformation steps most databases skip, so a formulated product gets modelled as what it is, not approximated from a commodity proxy.
A footprint R&D can put to work, not just report
03

See the impact of a reformulation before it ships.

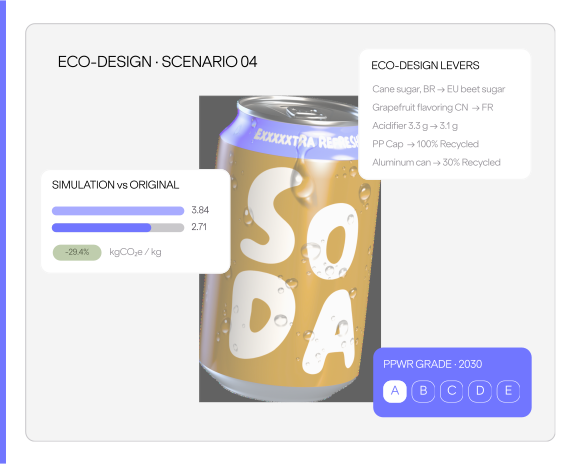
Because the model runs at ingredient and recipe level, product and packaging teams can simulate a reformulation, a sourcing change, or a packaging swap and see the carbon impact immediately, instead of finding out a year later in the next reporting cycle.
Numbers built to survive whoever questions them
04

One methodology, whether it's a retailer, an auditor, or your own team asking.

Every factor, source, and assumption is documented and traceable. The methodology is independently certified against the PACT Methodology V3 by TÜV Rheinland and validated by Bureau Veritas against ISO 14040, 14044, and 14067, and aligned with CSRD, SBTi, and the GHG Protocol, with FLAG treatment built in for the land-sector emissions food manufacturers can't avoid.
the platform

From corporate inventory to sourcing decisions, in one platform.

One system covering the corporate inventory, the product-level footprints behind it, the recipe and packaging decisions that shape it, and the sourcing decisions that come out the other end.
Corporate and product-level emissions

A Scope 3 inventory built up from every product footprint behind it, not a spend-based estimate.

See Scope 1, 2, and 3 emissions the way the business actually runs (by brand, by site, by ingredient), backed by auditable, ingredient-level PCFs and LCAs across the full portfolio, including the smaller lines that usually get skipped.
Full GHG inventory across every brand, site, and legal entity in the group
Purchased goods and product-level footprints modelled ingredient-by-ingredient from actual recipes, not spend categories
Emission factors matched correctly even where supplier data is thin or missing
Full life cycle results across carbon, water, land use, and other PEF indicators, not carbon alone
FLAG emissions handled natively for agricultural raw materials
eco-design

See the footprint of a recipe or packaging change before you commit to it.

Simulate ingredient swaps, sourcing changes, and packaging alternatives in one scenario, and see the footprint update against the original product in real time.
Unlimited scenarios: ingredient proportions, ingredient swaps, sourcing changes, and packaging alternatives, modelled together rather than as separate exercises
Packaging-specific analysis down to material, recycled content, and end-of-life recyclability, the same data that doubles as PPWR prep (A-E grading for 2030, PFAS limits for 2026)
Scenario comparisons and benchmarking against industry averages to support the reformulation case internally
Built on the same 34,000+ food-specific emission factors used for reporting, so what R&D tests is what gets reported
sustainable procurement

Turn supplier environmental performance into sourcing decisions, not a parallel workstream.

Structured data collection from raw-material and packaging suppliers feeds directly into buying: compare suppliers on carbon, cost, and risk in one view instead of running sustainability alongside procurement.
Food-specific supplier questionnaires and a guided portal replace spreadsheet chasing and email follow-up, built for hundreds of suppliers, not a handful of pilot accounts
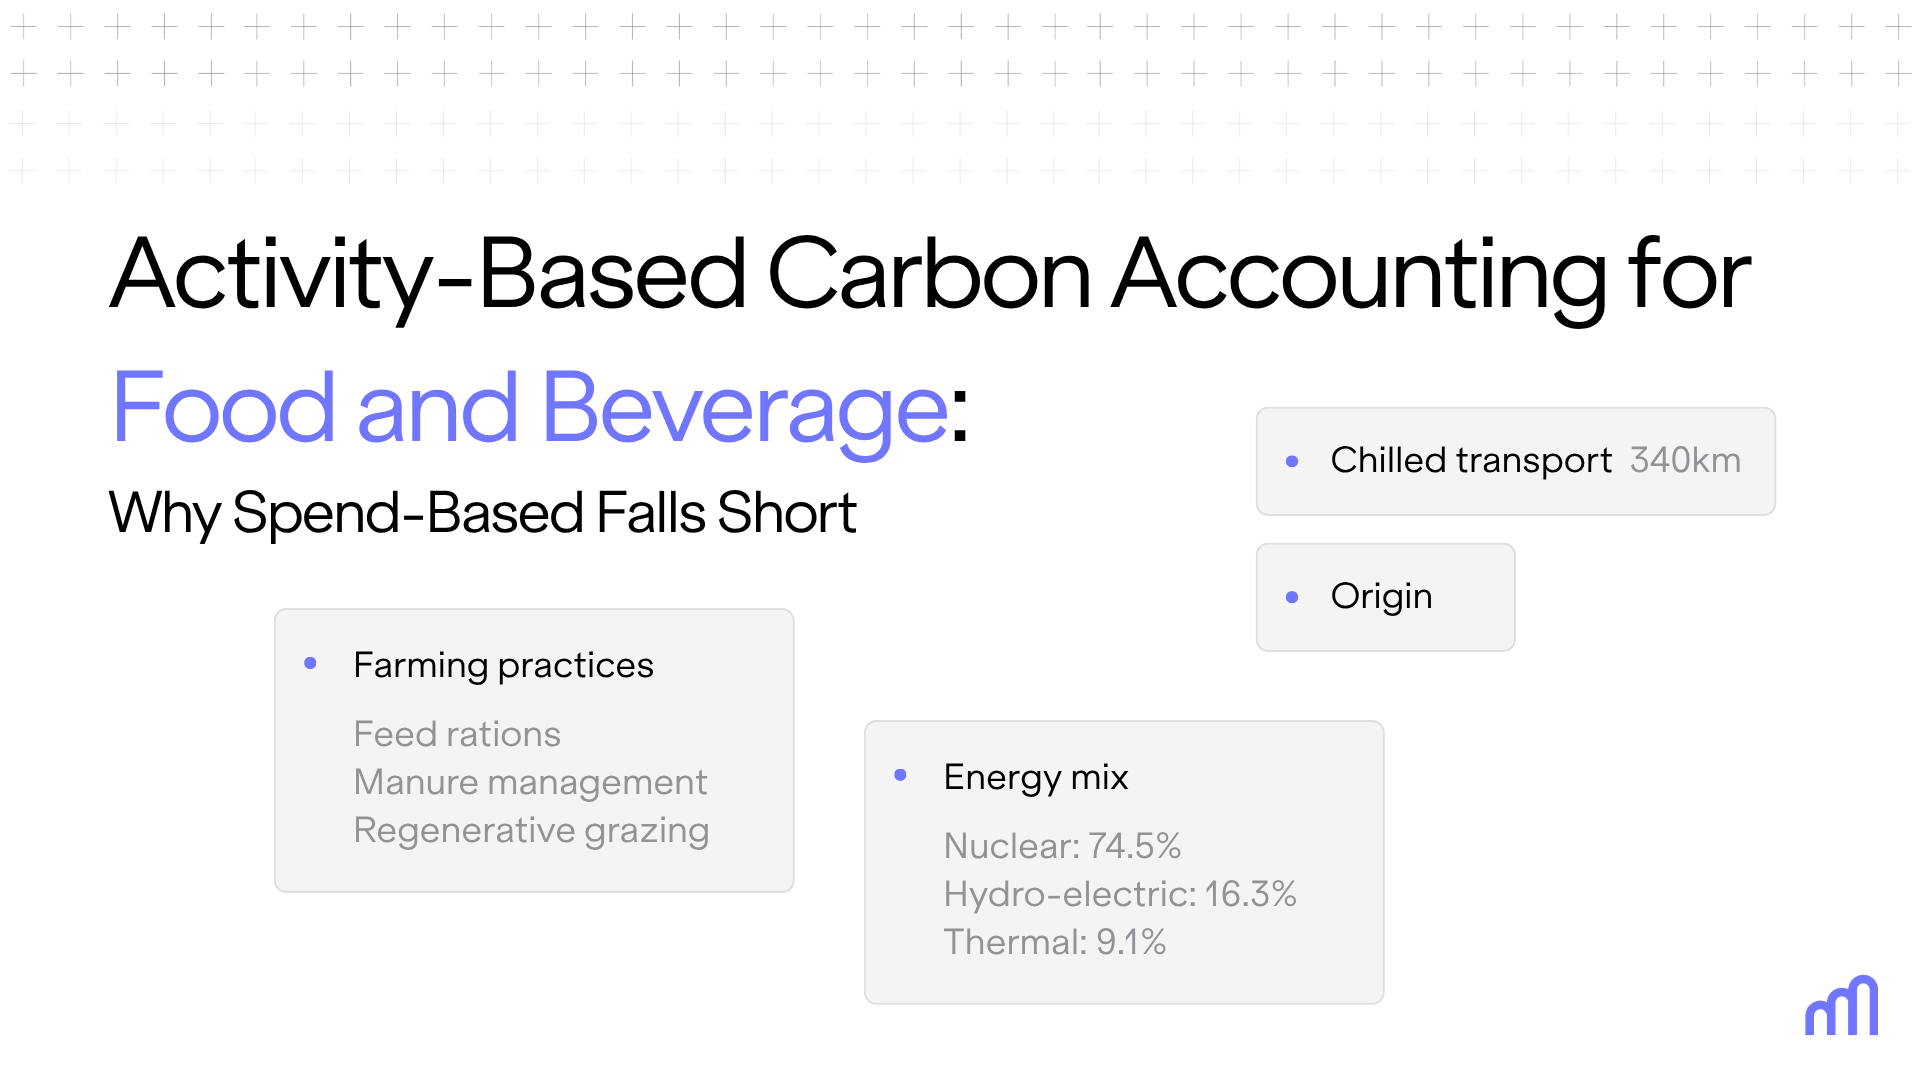
Emissions modelled at ingredient level (origin, farming practice, land use), not estimated from spend
Side-by-side supplier comparison across carbon, water, land use, and biodiversity, with scenario modelling for switching supplier, origin, or farming method
Year-on-year supplier scoring feeds contract negotiation and incentive design, aligned to SBTi FLAG pathways
customer stories

What this looks like in practice

From a 60-product pilot to a dairy-wide footprinting program

SODIAAL, France's leading dairy cooperative (Yoplait, Candia, Entremont), needed a way to footprint 3,700+ products across a genuinely fragmented IT landscape. Carbon Maps built a dairy-specific methodology with them, starting small and scaling to thousands of references and 100+ users across the cooperative.

The impact wasn't where the team expected it to be

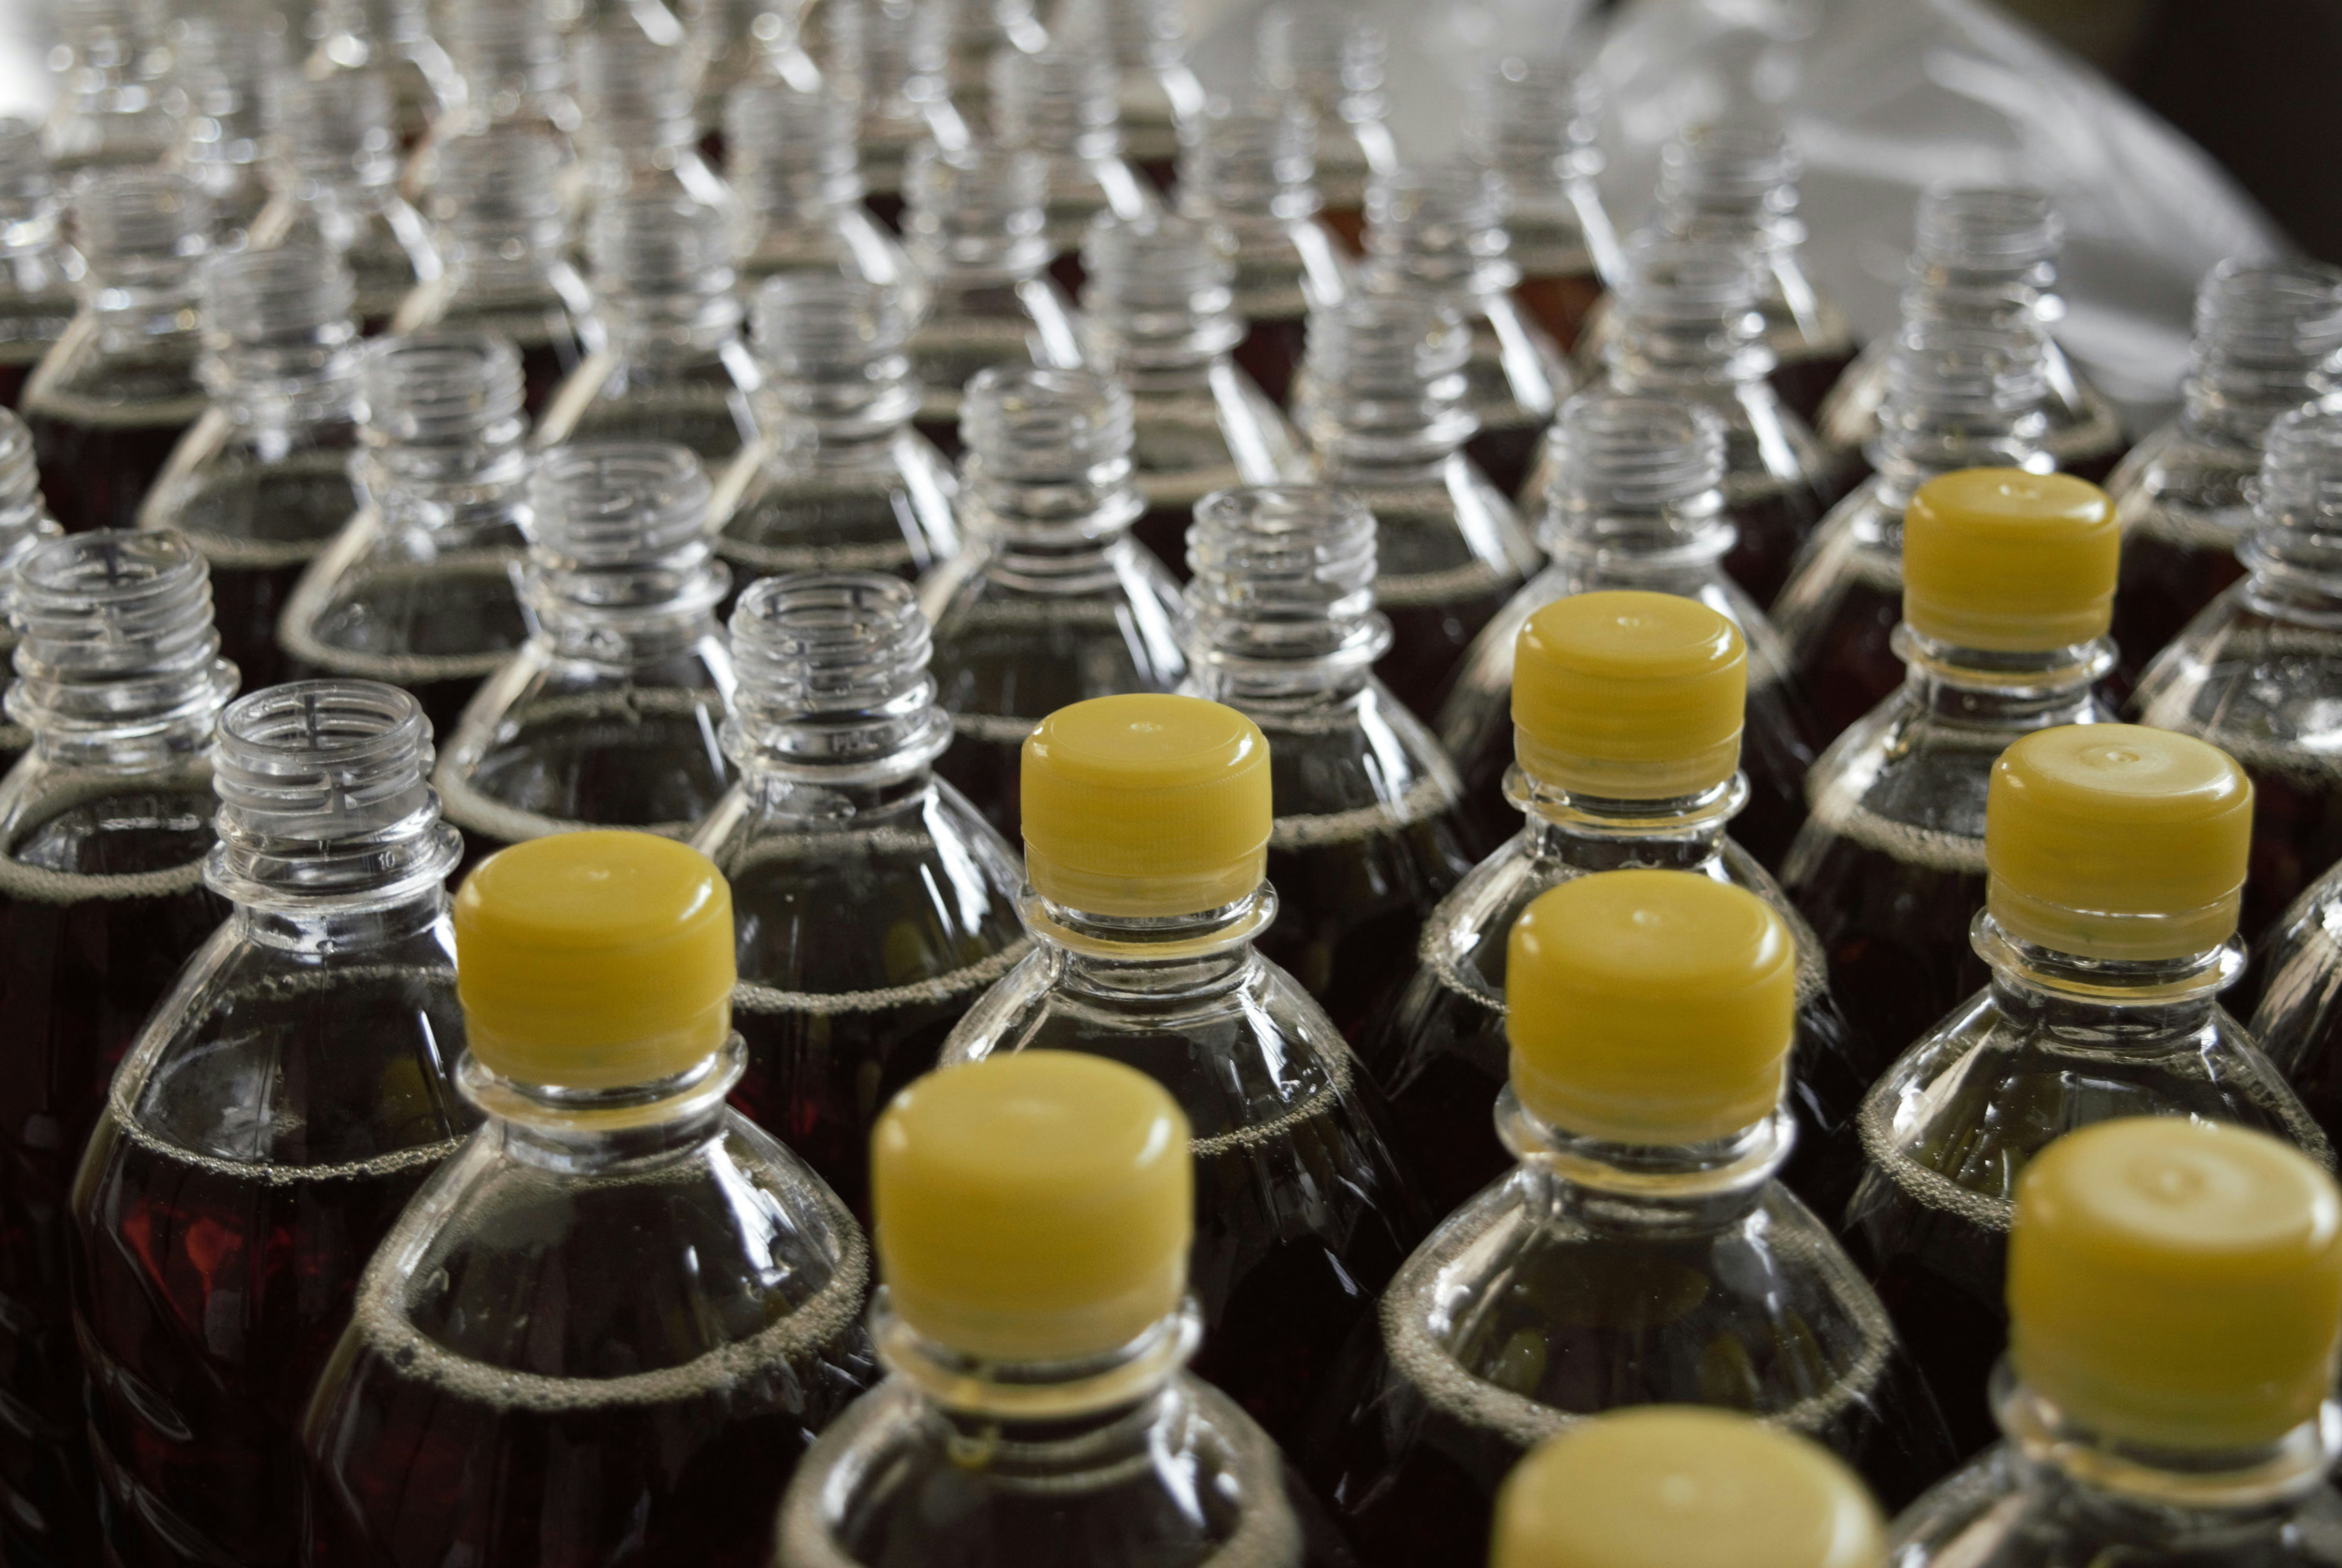
A leading French bottled water manufacturer assumed production would dominate its footprint. Granular, product-level PCFs across multiple products and sites showed packaging (44.3%) and transport (43.4%) were the real drivers. That finding led to a quantified reduction roadmap (recycled PET, format changes, logistics) worth ~11% at scale.
FAQ

Common questions from food manufacturers looking to incorporate environmental KPIs into their products.

The practical questions that come up once carbon becomes part of the product roadmap.
Why don't generic emission factor databases work for processed food products?
+
Generic databases are built around raw agricultural commodities (a litre of milk, a kilo of wheat), not the transformed products a manufacturer actually sells. Processing steps like concentration, blending, and distillation change the footprint materially, and most public databases have no factor for them. That gap is usually where manufacturers' PCFs get challenged first.
We run hundreds of ingredient and packaging suppliers through multiple ERPs. Can this actually scale?
+
That's the specific problem Carbon Maps' data ingestion is built to handle: reconciling material and recipe data from SAP, PLM, and regional systems into one model, and running structured supplier workflows across a full raw-material and packaging base rather than a handful of accounts at a time.
Can procurement actually use this data to change sourcing, or is it just for tracking suppliers?
+
Carbon Maps' Sustainable Procurement solution built to change sourcing. Supplier environmental performance is compared side by side with cost and risk, with scenario modelling for switching supplier, origin, or farming method, so a buying decision can weigh carbon alongside price instead of after the fact.
Is Carbon Maps' methodology certified for CSRD and SBTi FLAG reporting?
+
Yes. Outputs are aligned to CSRD/ESRS E1, the GHG Protocol, and SBTi, including dedicated FLAG treatment for agricultural inputs. The methodology is also independently certified against the PACT Methodology V3 by TÜV Rheinland and validated by Bureau Veritas against ISO 14040, 14044, and 14067.
Can this data actually inform reformulation, or is it just for reporting?
+
Because the model works at ingredient and recipe level, R&D and product teams can simulate a reformulation, sourcing change, or packaging swap and see the footprint impact directly, before the product ships rather than a year later when the next report is due.
Does eco-design cover packaging, or just the recipe?
+
Both, in the same scenario. Carbon Maps models packaging material, format, recycled content, and end-of-life recyclability alongside the recipe, so a packaging change and an ingredient change can be tested together and compared against the original product before either one ships.
How do product-level footprints reconcile with our corporate Scope 1-3 numbers?
+
Both, in the same scenario. Carbon Maps models packaging material, format, recycled content, and end-of-life recyclability alongside the recipe, so a packaging change and an ingredient change can be tested together and compared against the original product before either one ships.

Further reading

Read about how food manufacturers can start moving past static reporting to reformulate recipes, redesign packaging, and turn supplier data into sourcing decisions.
Blog Image

PPWR 2026 Updates for Food Packaging

Read
arrow forward
Blog Image

UK SRS Explained: What Food Companies Need to Know for 2027

Read
arrow forward
Blog Image

How Carbon Maps' PCF Calculation Methodology for the Food Industry Was Built to Be Trusted

Read
arrow forward