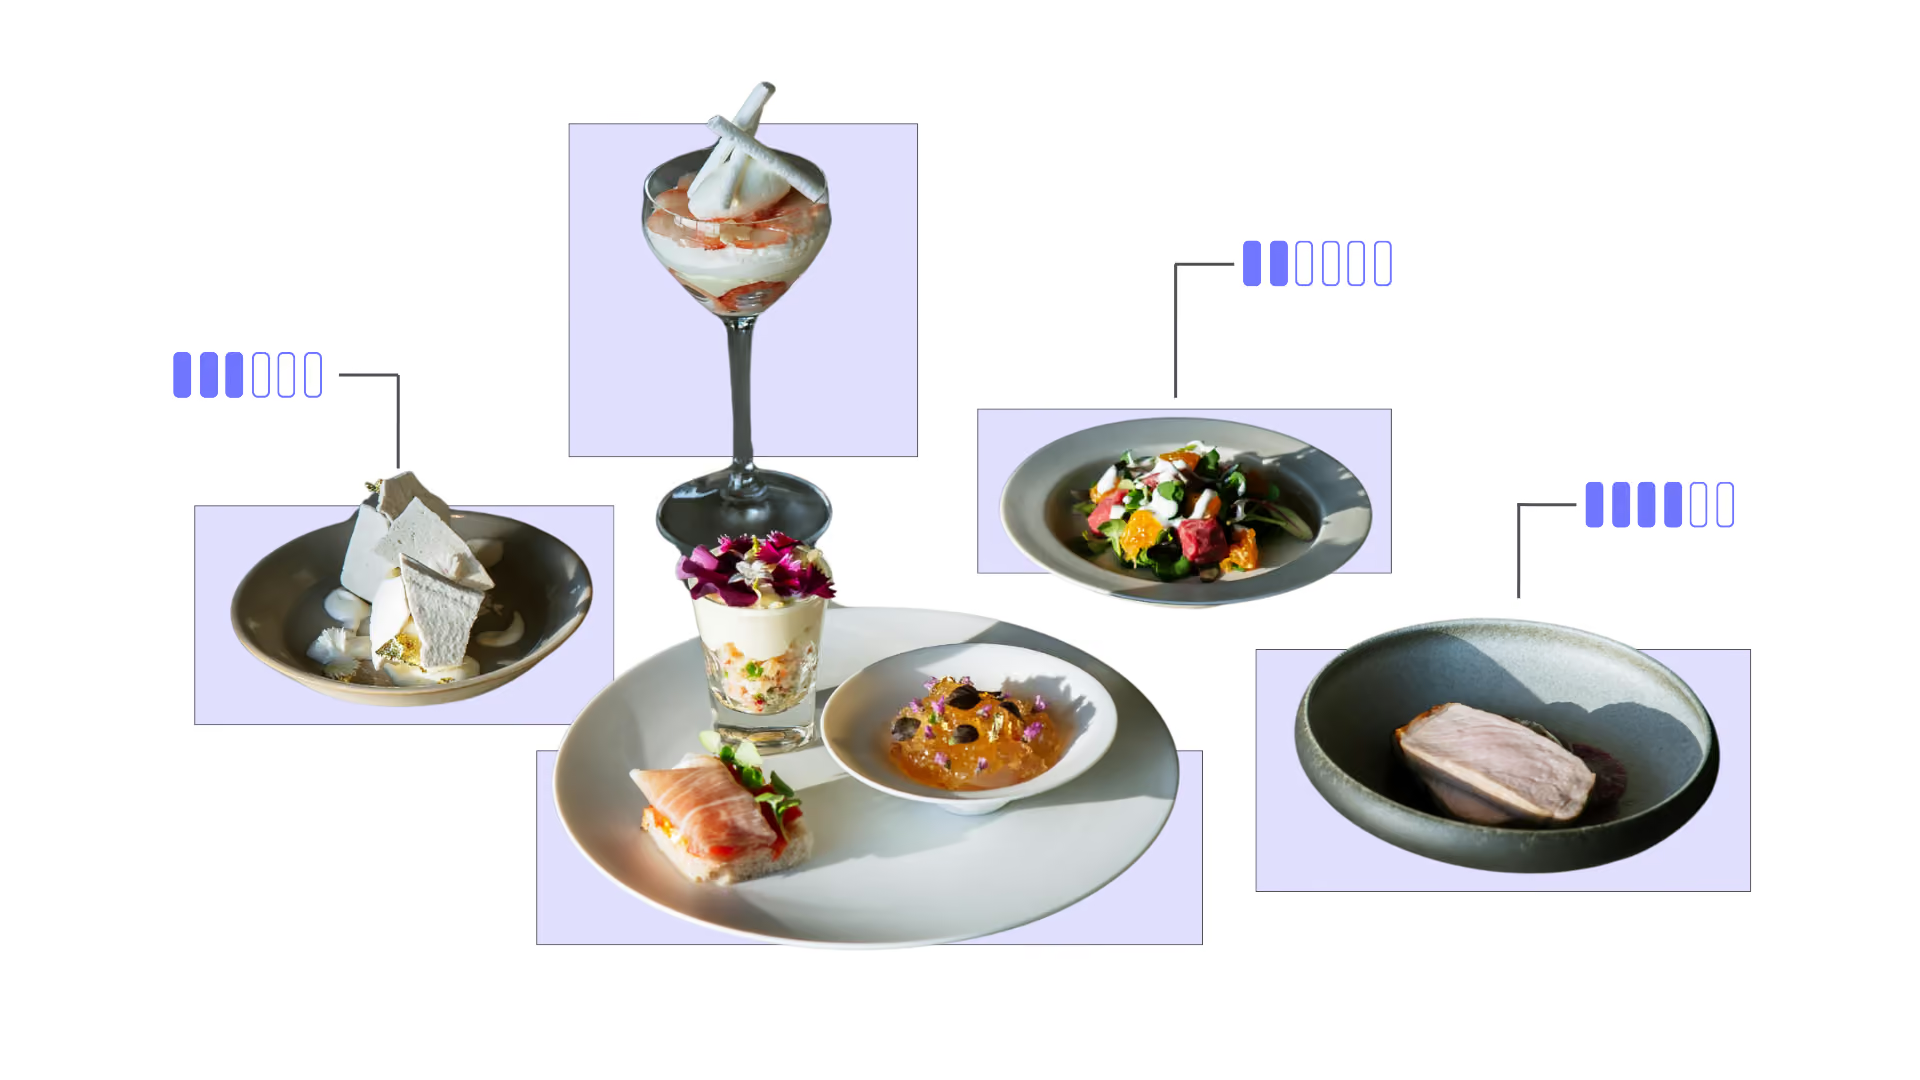
A tray of various vegetarian dishes
Food service and hospitality

Win more deals with your menu's carbon data

Turn your menu and purchasing data into a footprint you can put in front of a client tender before carbon becomes a formal requirement in the RFP.
the challenge

Your menus turn over every few weeks. A one-off carbon study doesn't.

Across catering, restaurants, hotels, and foodservice distribution, purchased food and beverages typically account for 60–80% of total emissions — the largest, and hardest to pin down, share of the footprint.
That data rarely arrives ready to use. It's scattered across wholesaler invoices and distributor PDFs, with little supplier visibility and country-of-origin gaps.
So teams fall back on static assessments that go stale with every recipe or supplier change, while clients demand proof in RFPs and reduction plans stall for lack of a trusted number.
Why Carbon Maps

Emissions data that keeps pace with your menu, not a report that's out of date by the time it lands.

Carbon Maps is a platform built on food-industry data and the structure of a real kitchen supply chain, from wholesaler purchasing to the recipe on the plate.
more granular than a category average
01

Recipe-level footprints from your actual menu

Carbon Maps' generative AI matches every ingredient in a recipe to its own emission factor rather than applying one blended figure per dish, using a food-specific database of 34,000+ emission factors. The same logic that let Foodles score 600+ recipes now applies to any menu, however often it turns over.
Structured dataset from fragmented supplier PDFs
02

Purchasing data extracted from the paperwork you already have

Delivery notes, wholesaler invoices, and distributor exports are read automatically by Carbon Maps' extraction engine and reconciled into one procurement dataset. It's the same approach that turned a luxury hotel's food purchasing records into a usable carbon footprint without a single manual entry.
regularly updated data
03

A footprint that updates when your menu does

When a recipe, supplier, or ingredient changes, the affected footprints update automatically instead of waiting for next year's assessment. Multi-site groups get one consistent view across kitchens, restaurants, and banquets instead of a patchwork of local estimates.
RFP-ready, Regulation-proof
04

Get ahead of the requirement, not caught by it.

Every emission factor, source, and methodology choice is documented and traceable, aligned with CSRD, SBTi, and GHG Protocol. Certified compliant with the PACT Methodology V3 (independently validated by TÜV Rheinland under ISO 14064-3) and validated by Bureau Veritas (ISO 14040/44/067): data you can put in front of a client tender or an auditor with equal confidence.
the platform

From kitchen to client tender: where carbon data does the work.

One platform covering the corporate inventory, the menu, and the purchasing data behind both.
a unified footprint across operations

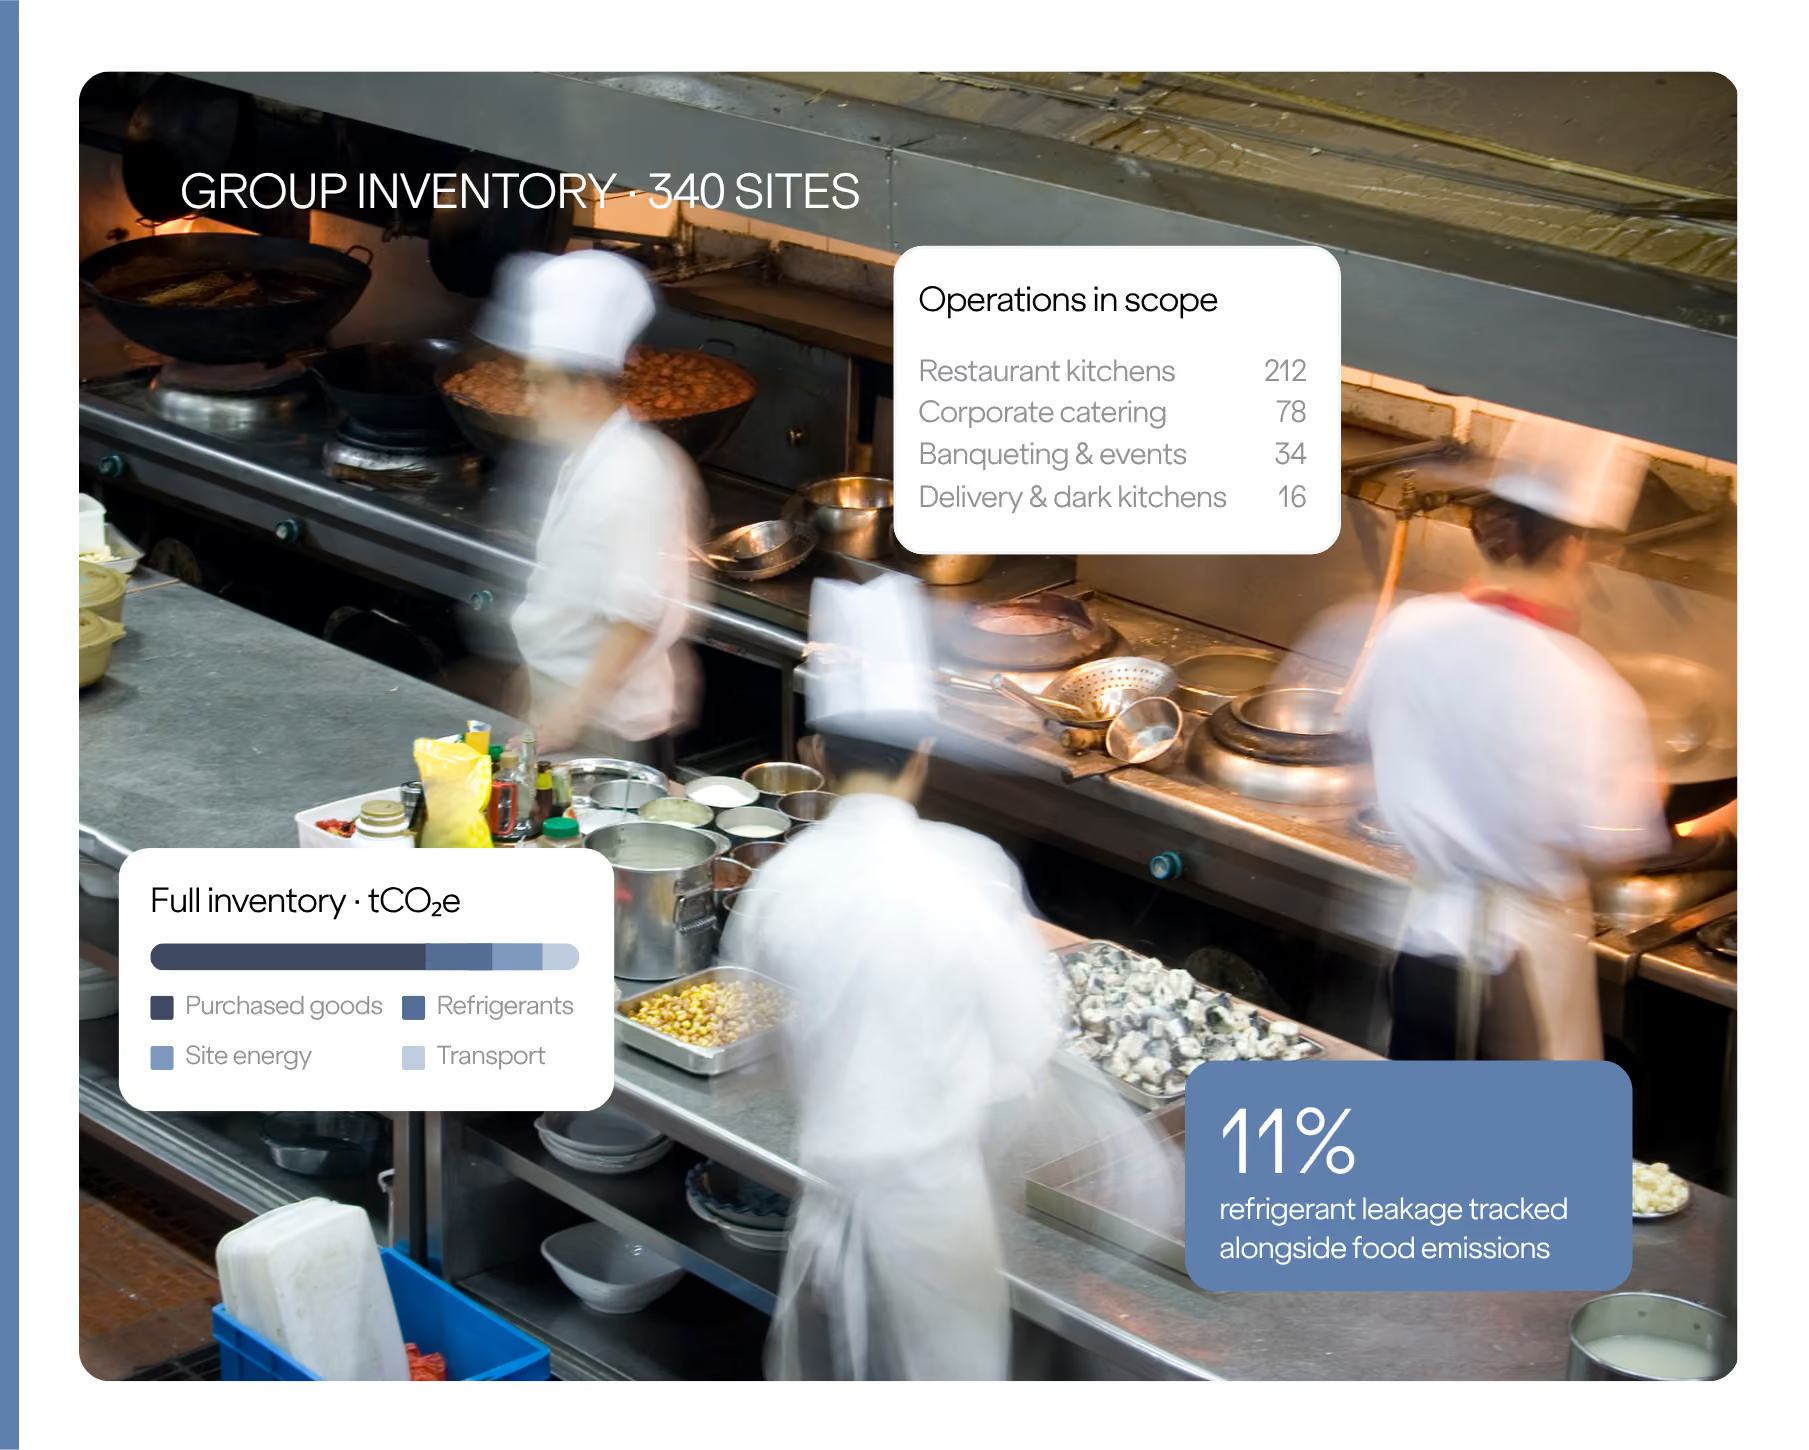
Everywhere you operate, accounted for in one inventory.

Your full emissions inventory, including the operational sources (refrigerants, energy, transport) that a food-only view misses.
A minimalist, ultra-thin line art icon to represent a check mark.
Complete GHG inventory across every site, kitchen, and banquet or delivery operation
A minimalist, ultra-thin line art icon to represent a check mark.
Purchased goods modelled at ingredient and recipe level, not estimated from category spend
A minimalist, ultra-thin line art icon to represent a check mark.
Refrigerant and cold-chain leakage tracked alongside food emissions, not left out
A minimalist, ultra-thin line art icon to represent a check mark.
Audit-ready outputs aligned with CSRD/ESRS E1, GHG Protocol, and SBTi
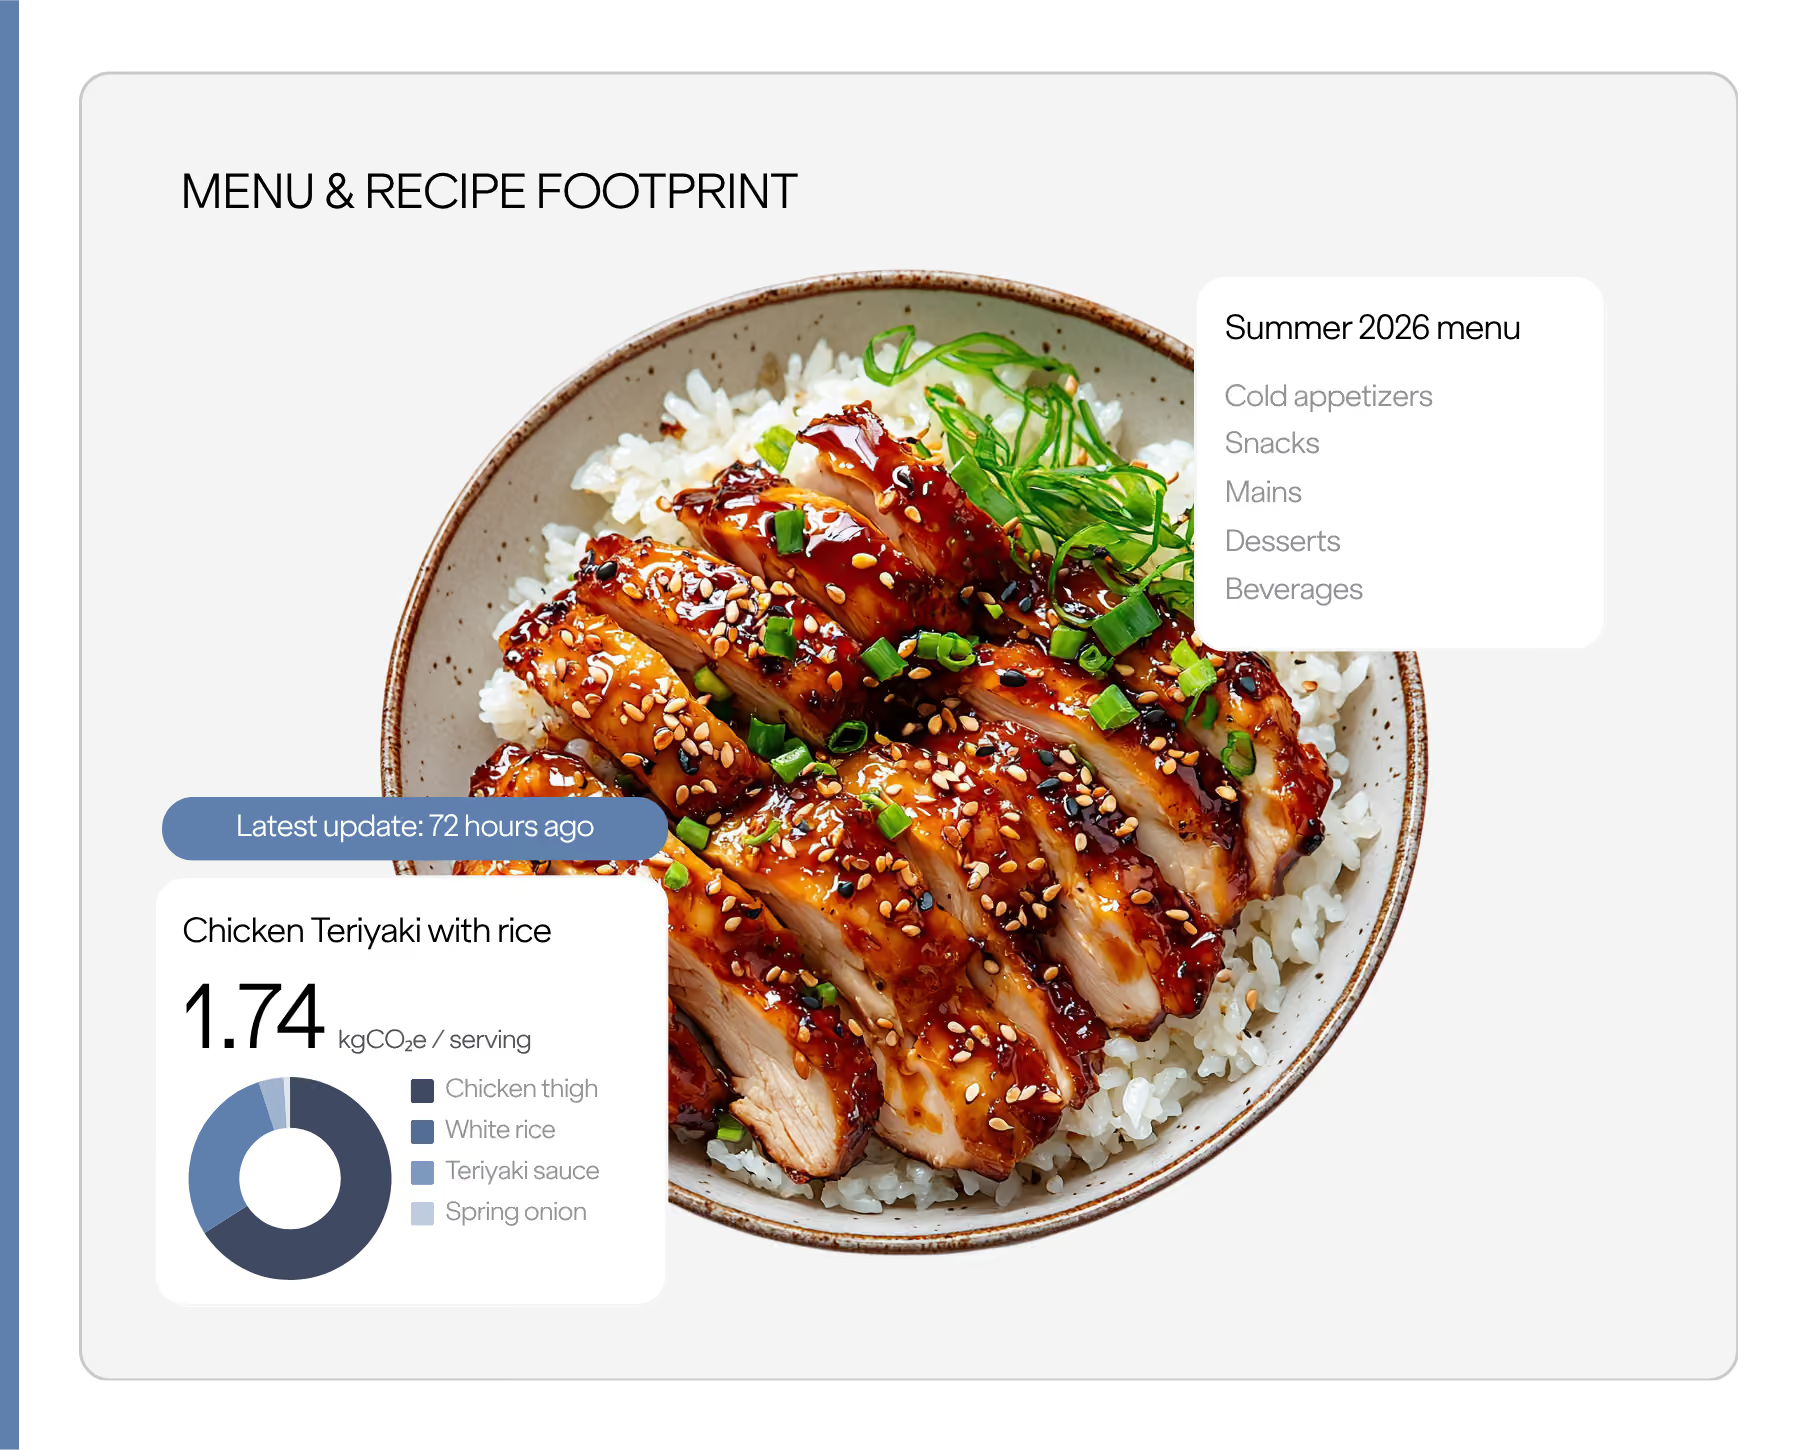
Menu & Recipe Carbon Footprint

Score every dish on your menu, and keep scoring it as the menu changes.

Automated, ingredient-level footprints for every recipe, refreshed as fast as your menu turns over.
A minimalist, ultra-thin line art icon to represent a check mark.
Automated PCFs and LCAs across full menus
A minimalist, ultra-thin line art icon to represent a check mark.
Draws on 34,000+ food-specific emission factors to fill gaps in supplier data, instead of a generic average.
A minimalist, ultra-thin line art icon to represent a check mark.
Footprints update automatically when a recipe or ingredient changes, no re-commissioned study
A minimalist, ultra-thin line art icon to represent a check mark.
Powers consumer-facing environmental labelling and internal menu-engineering decisions
Purchasing & Supplier Data Collection

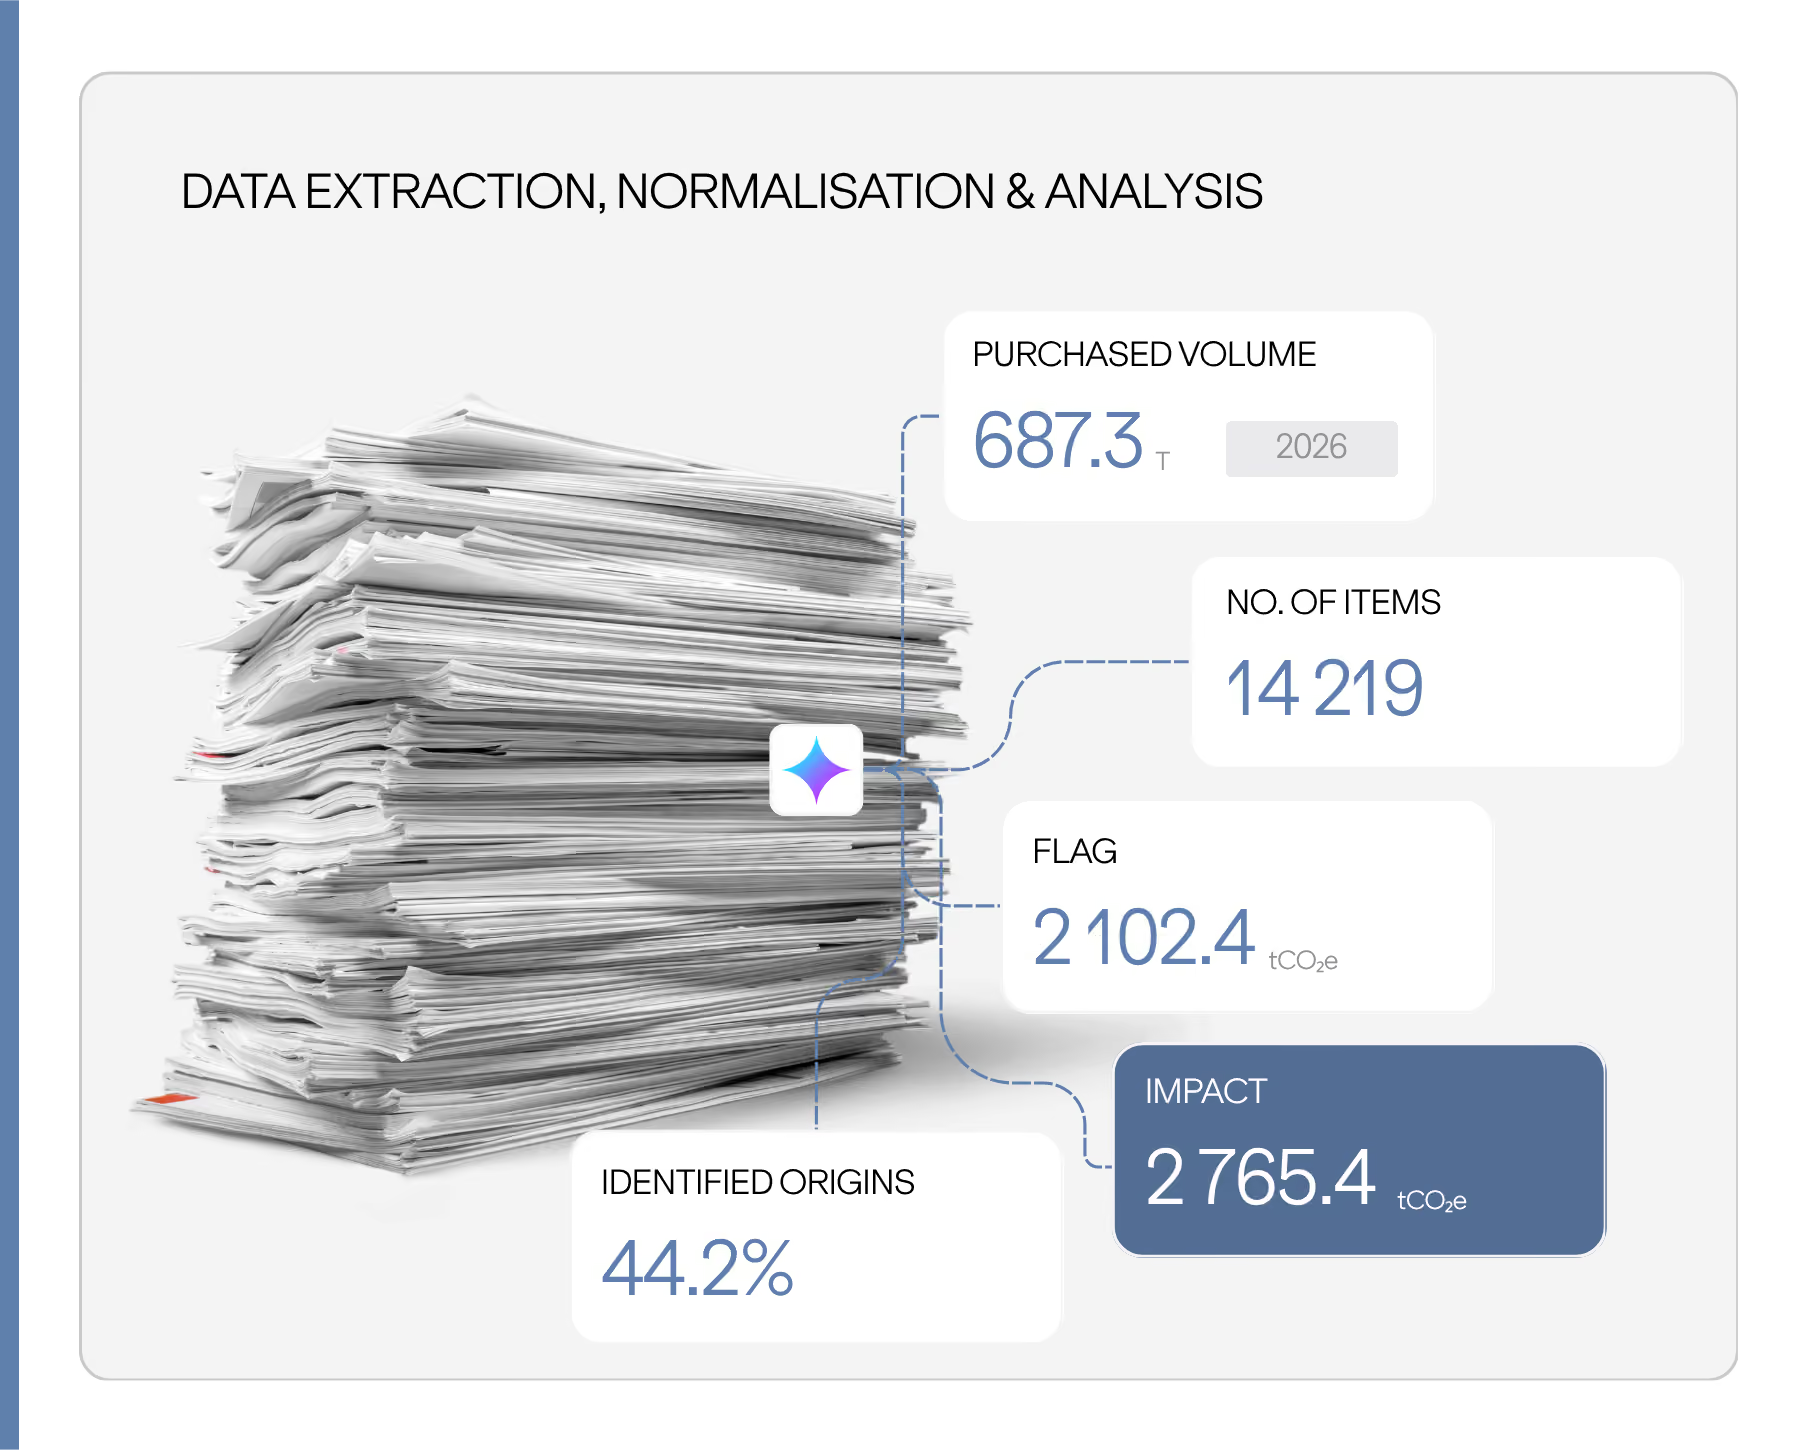
Turn the wholesaler invoice pile into a usable procurement dataset.

Structured data from the suppliers and distributors you actually buy from, not a template they'll ignore.
A minimalist, ultra-thin line art icon to represent a check mark.
Generative AI extraction reads delivery notes, invoices, and distributor exports automatically
A minimalist, ultra-thin line art icon to represent a check mark.
Structured workflows collect primary data, assess supplier maturity, and validate submitted footprints
A minimalist, ultra-thin line art icon to represent a check mark.
Built for multi-site purchasing groups and centralized buying, not a single spreadsheet
A minimalist, ultra-thin line art icon to represent a check mark.
New supplier or purchasing data flows through: every affected recipe and site updates automatically
customer stories

How our clients are already turning purchasing and menu data into decisions.

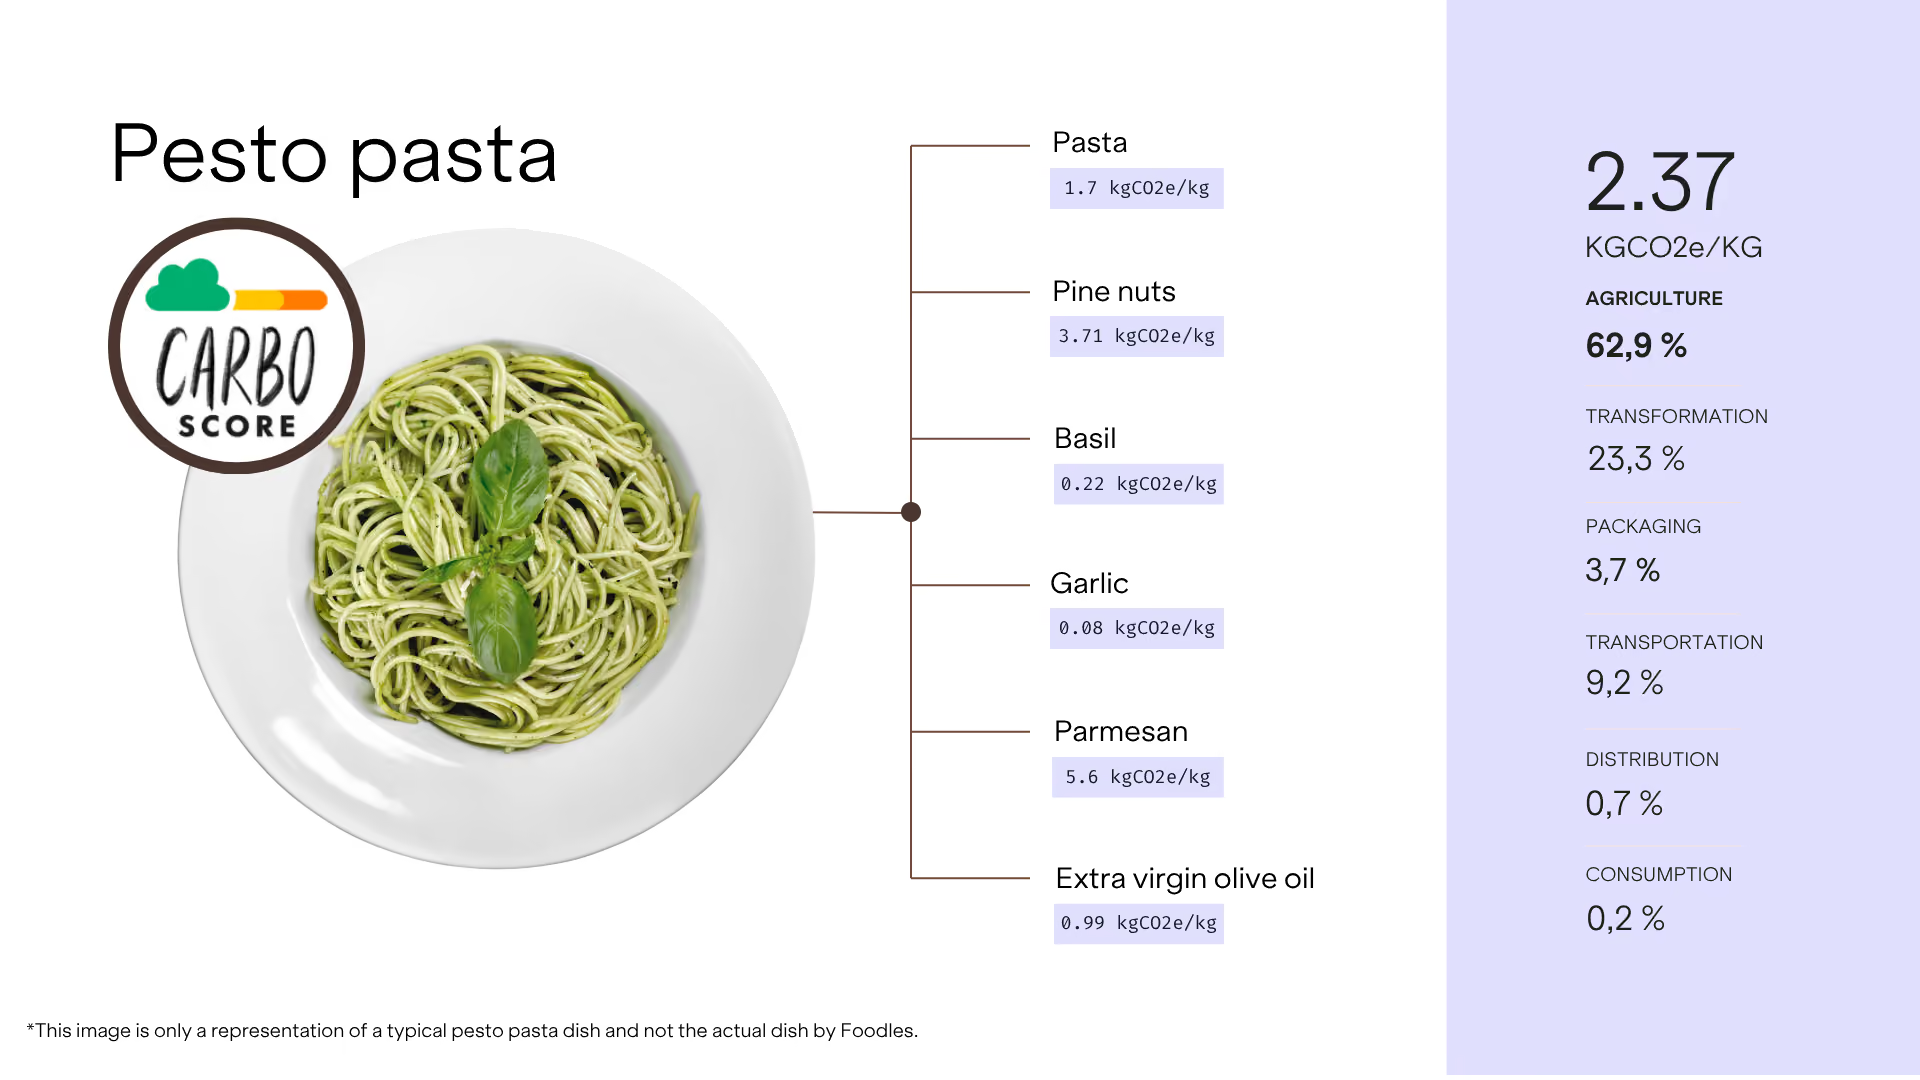
From 600+ recipes to a Carbo Score on every fridge screen.

Foodles, the connected workplace-catering scale-up, partnered with Carbon Maps to assess the environmental impact of its recipes and build its own environmental label, the Carbo Score. Carbon Maps' generative AI matches every ingredient, down to the pine nuts in a pesto, to its own emission factor rather than a single blended figure per dish, so Foodles can identify which recipes and ingredients drive the most impact, link that to sales data, and prioritize what to rework first.

From thousands of supplier PDFs to a clear carbon footprint, in hours.

A luxury hotel wanted a precise, ingredient-by-ingredient view of its gastronomy footprint, but its purchasing data sat scattered across thousands of PDF delivery notes from restaurants, bars, pâtisserie, and banquets. Carbon Maps' generative AI extraction engine processed the full document set and rebuilt the hotel's procurement dataset in hours, turning 772 tonnes of food purchasing into an actionable footprint.
FAQ

What food service and hospitality teams want to know before scoring their menu.

The most common questions from restaurant groups, caterers, and hotels evaluating carbon data.
How can food service companies measure the carbon footprint of their menus at scale?
+
Food service companies can measure menu-level carbon footprints at scale by modelling each recipe ingredient by ingredient, instead of applying one category average per dish. That level of detail is only possible with automation and access to a large database of emission factors, which is what lets Carbon Maps score hundreds or thousands of recipes without running a manual LCA for each one.
Can catering and restaurant groups get environmental data from their wholesalers and distributors?
+
Catering and restaurant groups can get environmental data from wholesalers and distributors by extracting it directly from the purchasing documents they already receive. Carbon Maps reads delivery notes, invoices, and distributor exports with generative AI and reconciles them into one procurement dataset, even when suppliers don't provide product-level footprints on request.
Is Carbon Maps data ready for CSRD, client RFPs, and environmental labelling requirements like France's Affichage Environnemental?
+
Carbon Maps data is audit-ready for CSRD, SBTi, and GHG Protocol reporting, and is built to support environmental labelling initiatives such as France's Affichage Environnemental. The methodology is independently certified against the PACT Methodology V3 by TÜV Rheinland and validated by Bureau Veritas against ISO 14040, 14044, and 14067, so the same data holds up whether it's going to an auditor or into a client tender.
Can food service groups use carbon data to respond to client RFPs before it becomes a formal requirement?
+
Food service groups can use carbon data to respond to client RFPs before carbon becomes a formal requirement by having defensible, recipe-level footprints ready ahead of time. Getting ahead of the requirement, rather than scrambling to produce a number once a tender demands it, is increasingly how catering and contract food service providers differentiate in competitive bids.
How long does it take to get a carbon footprint for our menu?
+
Once purchasing and recipe data is available, Carbon Maps' automated matching engine can score a menu in a matter of seconds, not the months a manual LCA takes, since each recipe is modelled automatically instead of commissioned one at a time. Footprints don't wait for an annual refresh either: whenever a recipe, ingredient, or supplier changes, only the affected dishes are recalculated, so the data stays current as the menu changes.

Further reading

Learn how food service and hospitality brands replace ad-hoc assessments and generic averages with recipe-level primary carbon data at scale.
Blog Image

Evaluating the environmental impact of recipes

Read
arrow forward
Blog Image

Tackling Scopes 1, 2, and 3 in Food Service

Read
arrow forward

Untitled has saved us thousands of hours of work. We’re able to spin up projects and features faster.

Koray Okumus
UX Designer, Circooles

We’ve been using Untitled to kick start every new project and can’t imagine working without it.

Candice Wu
Product Manager, Sisyphus