SBTi flag for food & ag

The carbon platform built to measure land-based emissions

For food and beverage, land-based emissions can't be estimated from sector averages. Carbon Maps calculates FLAG emissions from real recipes and supplier data, at product and ingredient level, every figure traced back to the source.
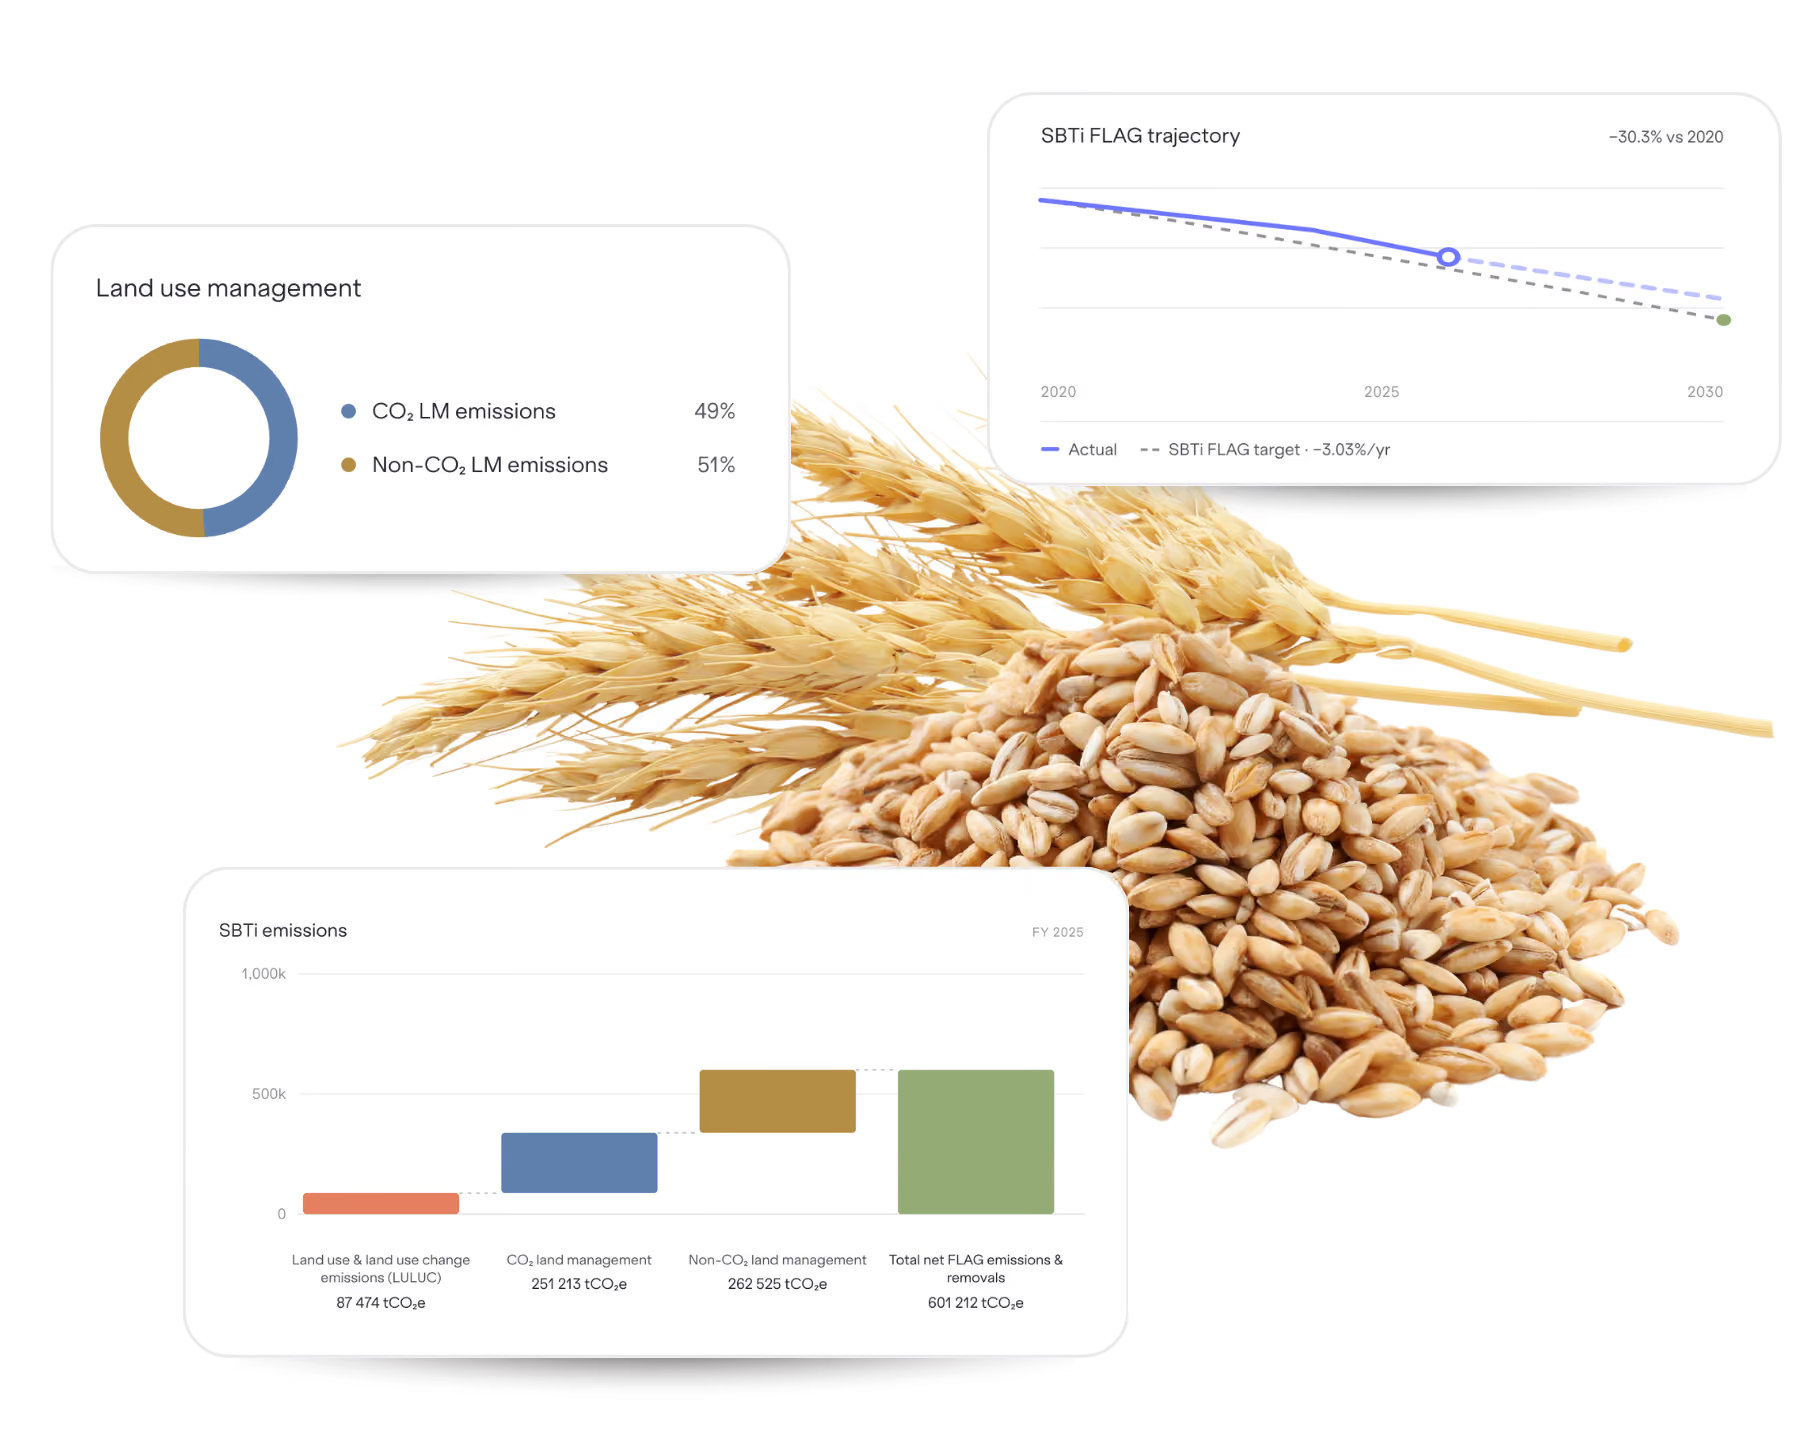
Carbon Maps platform showing SBTi FLAG reporting for a wheat product: a land management CO2 split, a FLAG reduction trajectory to 2030, and a breakdown of LULUC, land management and total net FLAG emissions.
results

Land-based emissions, measured where they happen.

A FLAG inventory you can stand behind, built from your real products rather than estimated from spend.

Know exactly which emissions count as FLAG

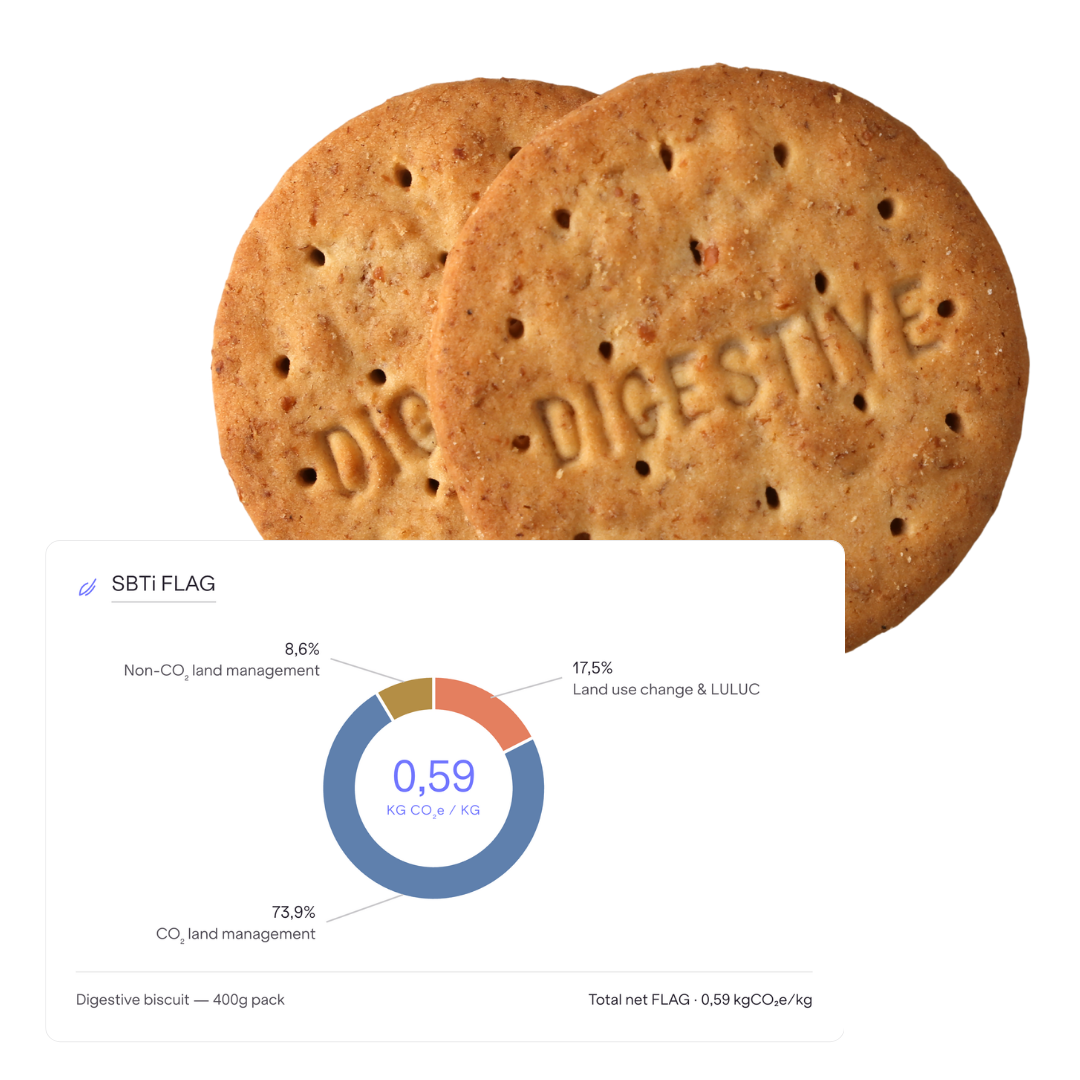
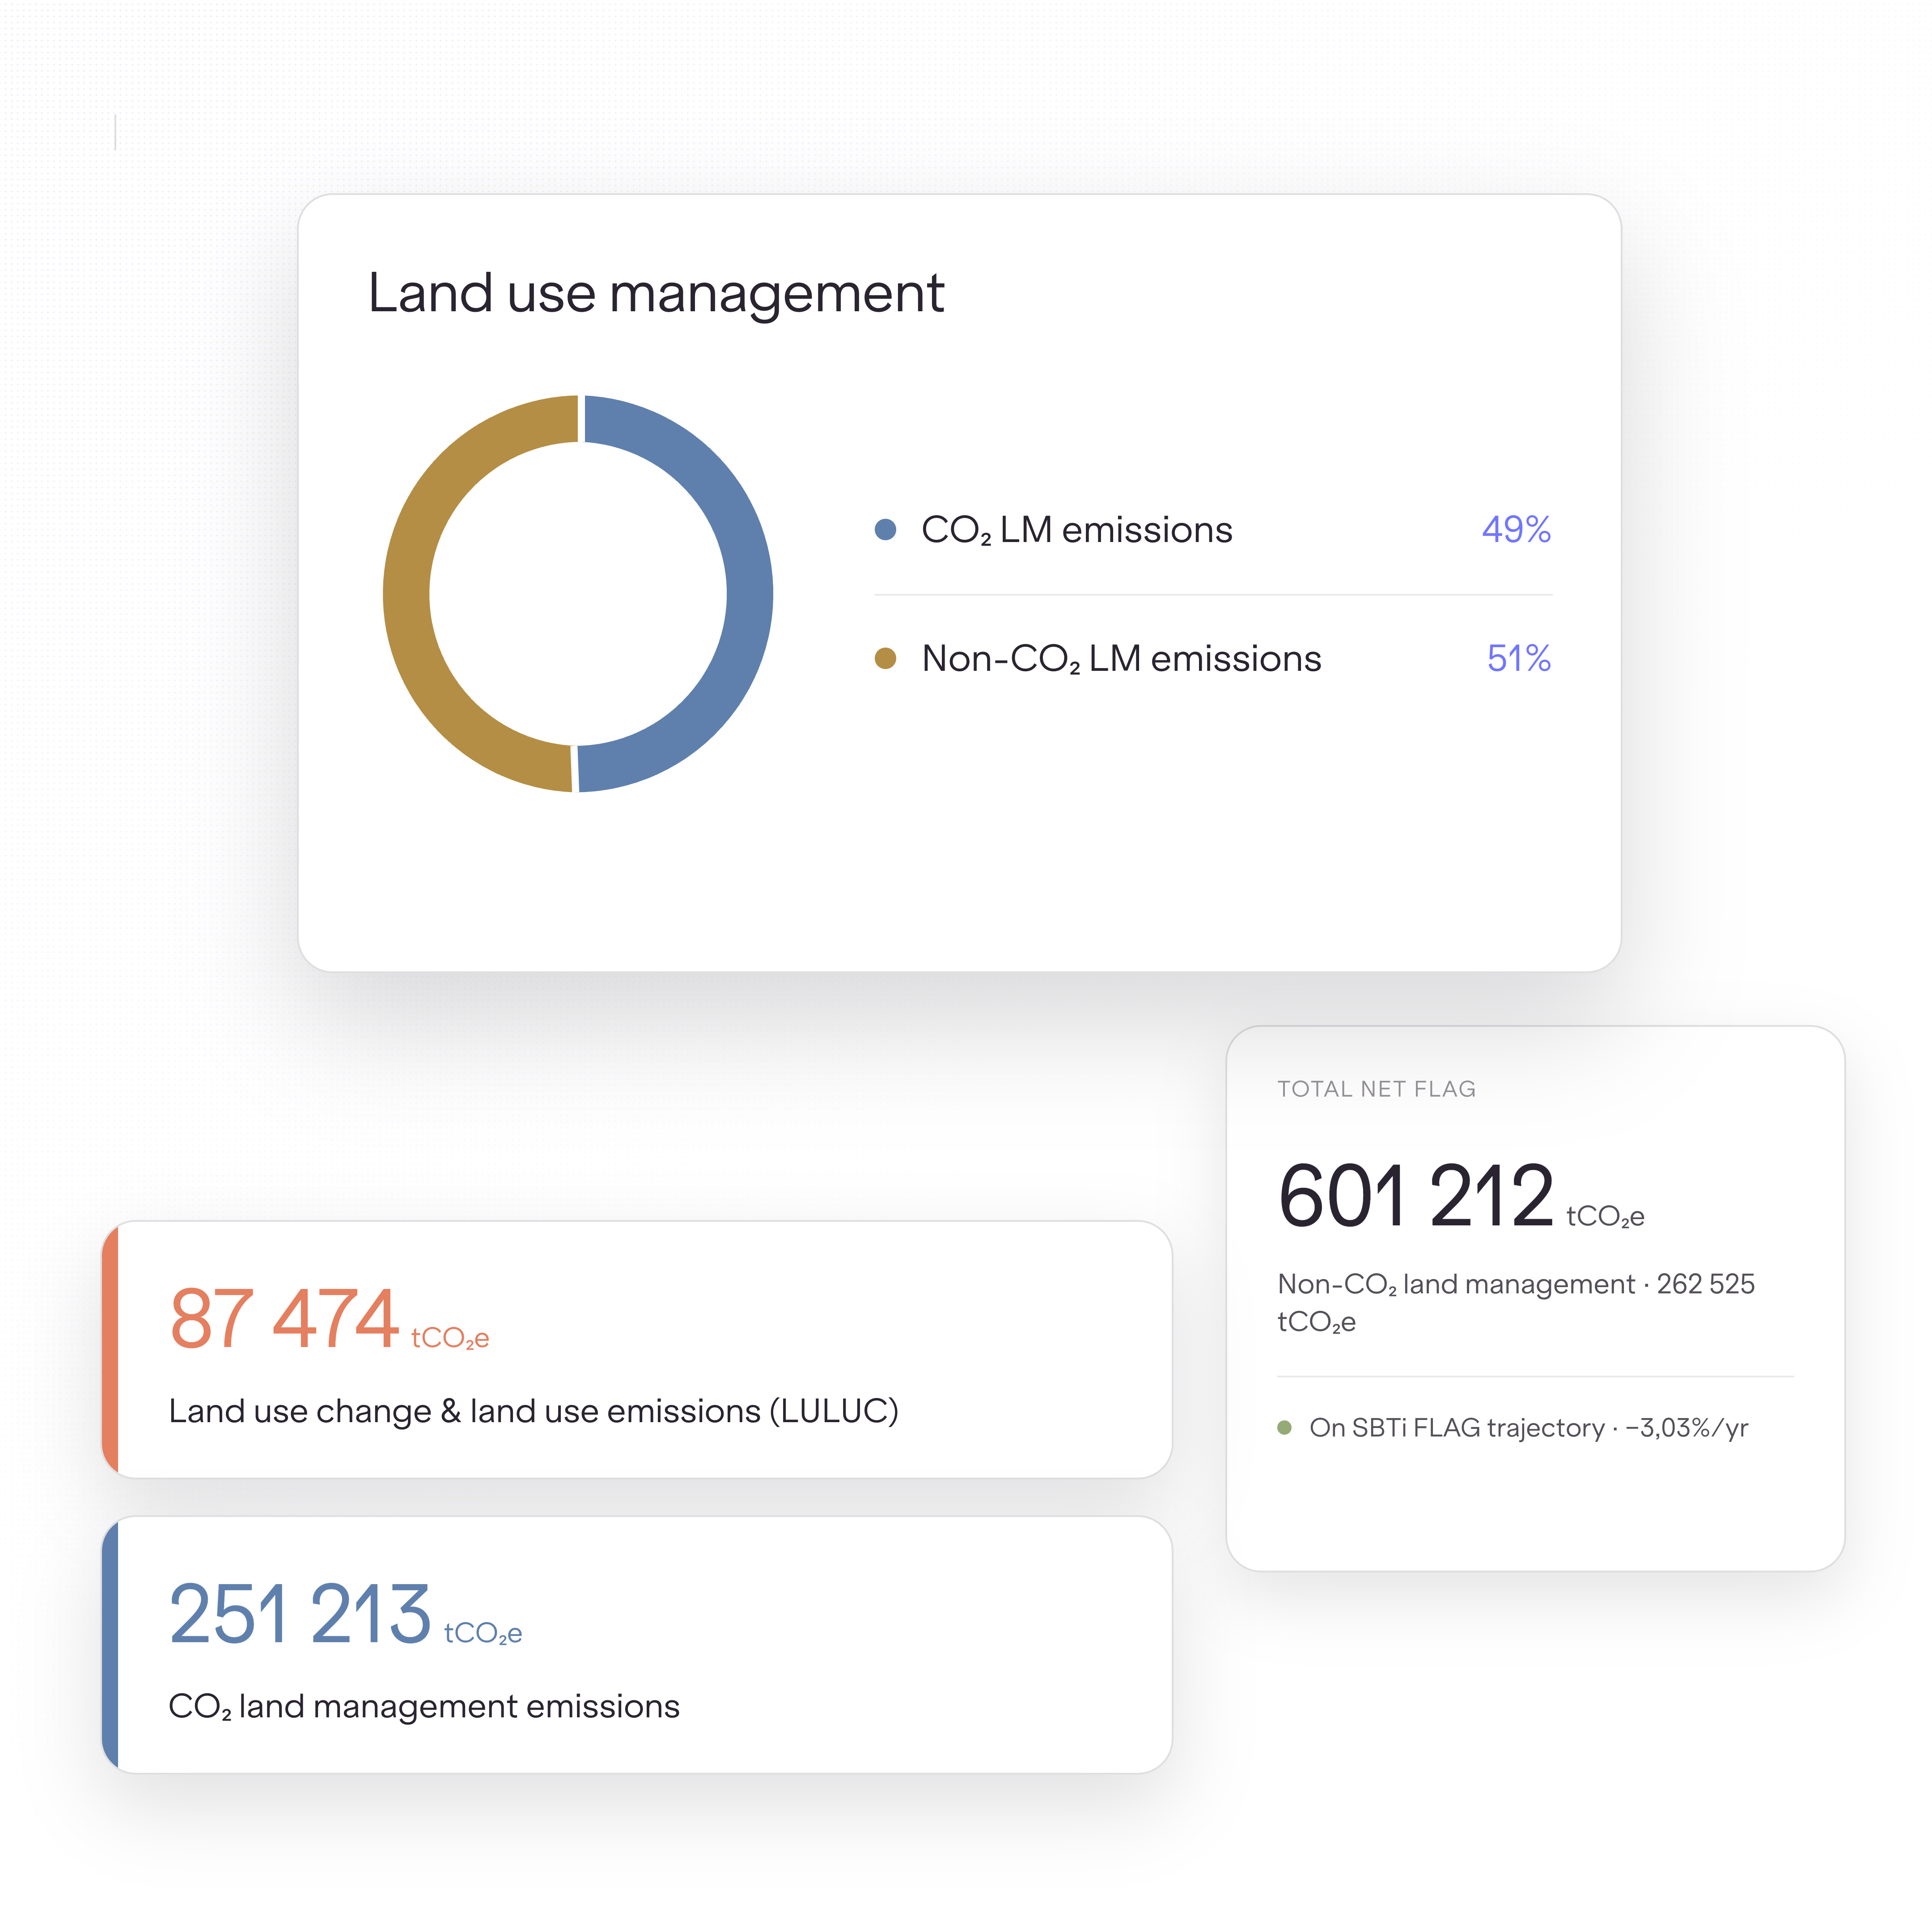
See a clean split between FLAG and non-FLAG for every product, with FLAG broken down into land use and land-use change, land management CO₂, and land management non-CO₂. You go into target-setting knowing the boundary holds, instead of defending an assumption.
Carbon Maps SBTi FLAG breakdown for a digestive biscuit, showing its FLAG footprint split across CO2 land management, non-CO2 land management, and land use change and LULUC.
Carbon Maps land use dashboard breaking down a company's SBTi FLAG footprint into land use change and LULUC, CO2 land management, and non-CO2 land management, with a total net FLAG figure and reduction trajectory.

Defensible from the first number

Your FLAG figures are built on the same recognised emission factors that public methodologies and assurance providers accept, so credibility isn't a conversation you have to win from scratch.

From a single ingredient up to your corporate target

Get FLAG intensity at the product level, packaging included, rolling up into the corporate inventory behind your SBTi target. The same numbers reduce reporting effort by flowing straight into your exports.
Go deeper on Corporate Carbon Footprint
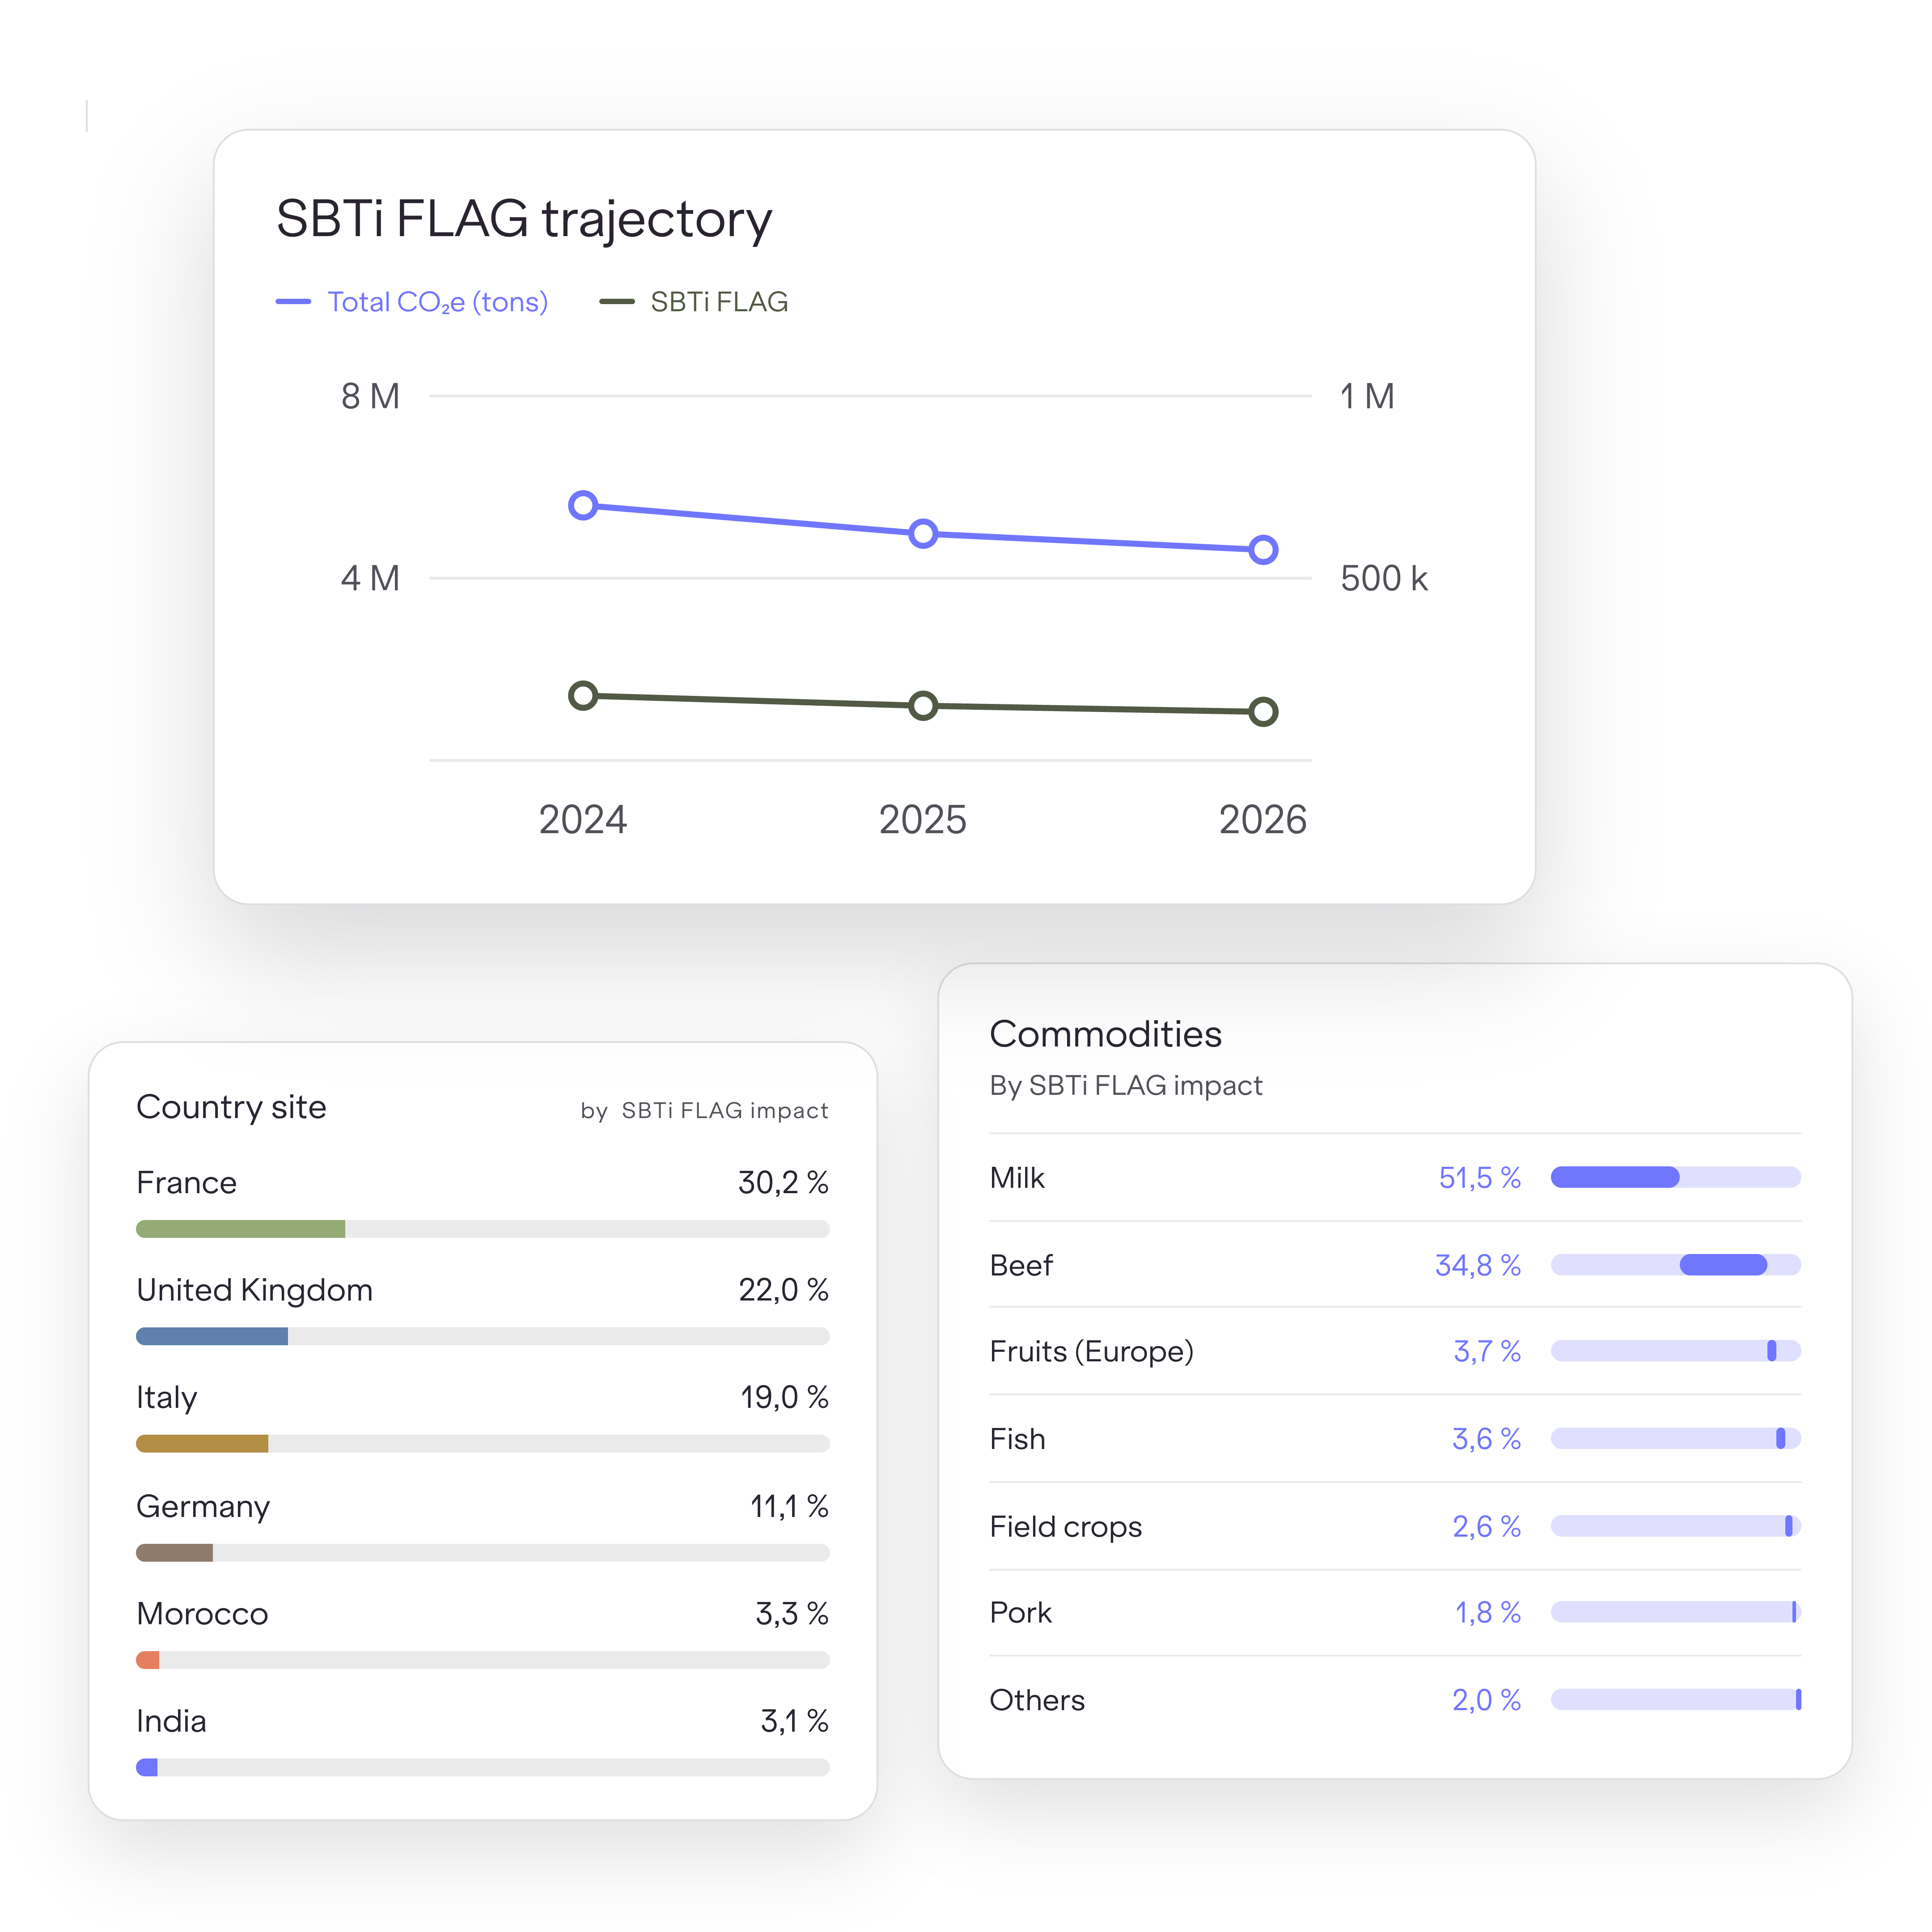
Carbon Maps dashboard showing an SBTi FLAG reduction trajectory over time, alongside FLAG impact broken down by country site and by commodity such as milk and beef.
trust & compliance

Numbers that hold up when someone checks them

Setting a FLAG target and passing assurance both put your data in front of a third party. Carbon Maps is built for that scrutiny.

ISO logoPACT logoBureau Veritas logoThe TUV logo
  • Our carbon accounting is validated by Bureau Veritas against ISO 14040, 14044 and 14067, and our PACT Methodology V3 is independently validated by TÜV Rheinland under ISO 14064-3. The standards your auditor already recognises.

  • Each number carries lineage back to its source document and emission-factor version. When an auditor asks why your Scope 3 figure is credible, you have the evidence trail, not just an estimate.

  • A persistent product database recomputes your footprint each reporting cycle, so your data stays comparable and audit-ready as requirements tighten toward reasonable assurance.
FAQ

Common questions on SBTi FLAG

From FLAG basics to target-setting, the questions we hear most
What is SBTi FLAG?
+
SBTi FLAG is the Forest, Land and Agriculture guidance from the Science Based Targets initiative, the first standard method for land-intensive companies to set science-based targets that include land-based emissions and removals. It requires eligible companies to set a FLAG target alongside their standard fossil-based science-based target, and both are submitted together in one validation package.
What are FLAG emissions?
+
FLAG emissions are greenhouse gas emissions from land and agricultural activity: land-use change such as deforestation, and land management emissions from practices like fertiliser use, livestock and soil management. For food and beverage companies they typically come from growing crops, raising animals and sourcing ingredients, and they are often the largest share of the total footprint.
Which companies need to set a FLAG target?
+
A FLAG target is mandatory for companies in food production, food and beverage processing, food and staples retailing, and tobacco, regardless of their emission profile. Any company in another sector must also set one if FLAG-related emissions exceed 20% of total emissions across Scopes 1, 2 and 3, which can bring in businesses such as hospitality and large food retailers that may not consider themselves agricultural.
How do you calculate FLAG emissions?
+
Calculating FLAG emissions means building an inventory that separates land-based emissions from the rest of your footprint, covering land use and land-use change, land management CO₂, and land management non-CO₂. It relies on product, recipe and supplier data mapped to recognised emission factors, rather than spend-based or sector-average estimates that cannot capture what happens on specific land.
What is the difference between the FLAG sector approach and the commodity approach?
+
The sector approach sets one target across your whole land-based footprint and suits companies with varied portfolios, such as retailers and diversified manufacturers. The commodity approach sets targets tied to specific high-impact commodities such as beef, dairy, soy, palm oil or wheat, and suits producers concentrated in one or two inputs. Many food companies combine the two.
Why does separating FLAG from non-FLAG emissions matter?
+
FLAG and non-FLAG emissions must be reported and targeted separately under SBTi guidance because they are reduced in different ways. Land-based emissions are cut through sourcing, farming practices and land management, while non-FLAG emissions are cut through energy, transport and processing. A clean split is also what keeps the inventory defensible under assurance.
Why can't a generic carbon platform compute food and beverage FLAG emissions?
+
Generic carbon tools rely on spend-based or sector-average factors, which cannot isolate emissions tied to specific land or its change of use. FLAG accounting needs computation from recipes, bills of materials and supplier data at product and ingredient level, which is the capability most general-purpose platforms lack.
How does Carbon Maps measure FLAG emissions?
+
Carbon Maps breaks each product's agricultural impact into FLAG and non-FLAG, then splits FLAG into land use and land-use change, land management CO₂, and land management non-CO₂. Products are modelled from their full composition, including packaging, and mapped to recognised emission factors from databases such as Agribalyse and Ecoinvent, giving a FLAG intensity per product that rolls up into your corporate inventory and SBTi target.
What changed in the SBTi FLAG guidance in 2026?
+
In March 2026 the SBTi updated its land and agriculture rules, including the deforestation timeline: rather than a fixed 2025 cut-off, companies now set a zero-deforestation target date no later than two years after submission, and no later than 31 December 2030. FLAG targets must also align with the GHG Protocol Land Sector and Removals Standard, which applies from 1 January 2027. See our blog on the latest SBTi FLAG guidance for a full breakdown.

Go deeper on SBTi and FLAG

The latest on SBTi guidance, EUDR and land-based emissions
Blog Image

SBTi Net-Zero Standard V2.0 is Final: What Changed Since the November 2025 Draft

Read
arrow forward
Blog Image

EUDR & SBTi: How Carbon Maps Helps Food & Beverage Brands Comply With Both

Read
arrow forward
Blog Image

What’s New in the SBTi Net-Zero Standard V2: November 2025 Update Explained

Read
arrow forward