supplier engagement

Turn supplier data into a Scope 3 you can act on.

Most platforms stop once Scope 3 is estimated. Carbon Maps helps you go to the source by collecting primary data from the suppliers behind your largest emissions, so your reduction plans rest on real data, not database averages.
the challenge

A corporate footprint tells you where emissions are. It doesn't help you reduce them.

For food companies, the bulk of Scope 3 sits in purchased goods and it's built on secondary emission factors and broad assumptions. That's enough to report a number. It isn't enough to build a credible reduction plan.
Real reduction happens with your suppliers, not despite them. But engaging them at scale runs into the same walls every time: suppliers don't have footprints to share, the ones who do calculate them differently, and manual questionnaires collapse under the weight of a real supplier base.
3.1category
purchased goods & services is the single largest, and hardest to measure, Scope 3 category for food companies.
100s
of suppliers to engage, assess, and follow — impossible to manage through spreadsheets and email.
Why Carbon Maps

Supplier engagement that gives something back.

Engagement fails when it becomes a compliance exercise. Carbon Maps is built on the opposite premise: make it fast for suppliers, give them something back, and use whatever data they already have.
01 - Fast for suppliers

Minimal effort, tailored to each supplier.

No generic mega-questionnaire. Questions adapt to each supplier's profile, so they only answer what's relevant and they always know exactly how their data will be used. Less burden means higher response rates on the suppliers that matter most.
02 - A two-way exchange

Give suppliers something back.

You're not just extracting data. Suppliers receive the product-level footprint estimates Carbon Maps has already calculated for what they sell you—a concrete starting point they can correct and refine, rather than a blank form. Engagement becomes a collaboration, not a demand.
03 - No supplier left behind

Usable data, whatever a supplier's maturity.

Carbon is only part of the picture. Carbon Maps calculates full life cycle assessments, covering water use, land use, biodiversity impact, and more, so your environmental reporting goes deeper without adding complexity for your team.
The platform

Everything supplier engagement requires, connected to the rest of your footprint.

01 · prioritise

Engage the suppliers that move your footprint first.

Supplier engagement built directly on your procurement data. Carbon Maps ranks suppliers by their weight in your emissions, so you spend effort where it changes the number, not on whoever answers first.
Supplier and category ranking based on emissions weight in your purchases
Coverage view: how much of your total footprint each campaign puts in reach
Built on the same purchasing data as your Scope 3.1 calculation — no re-entry
02 · collect

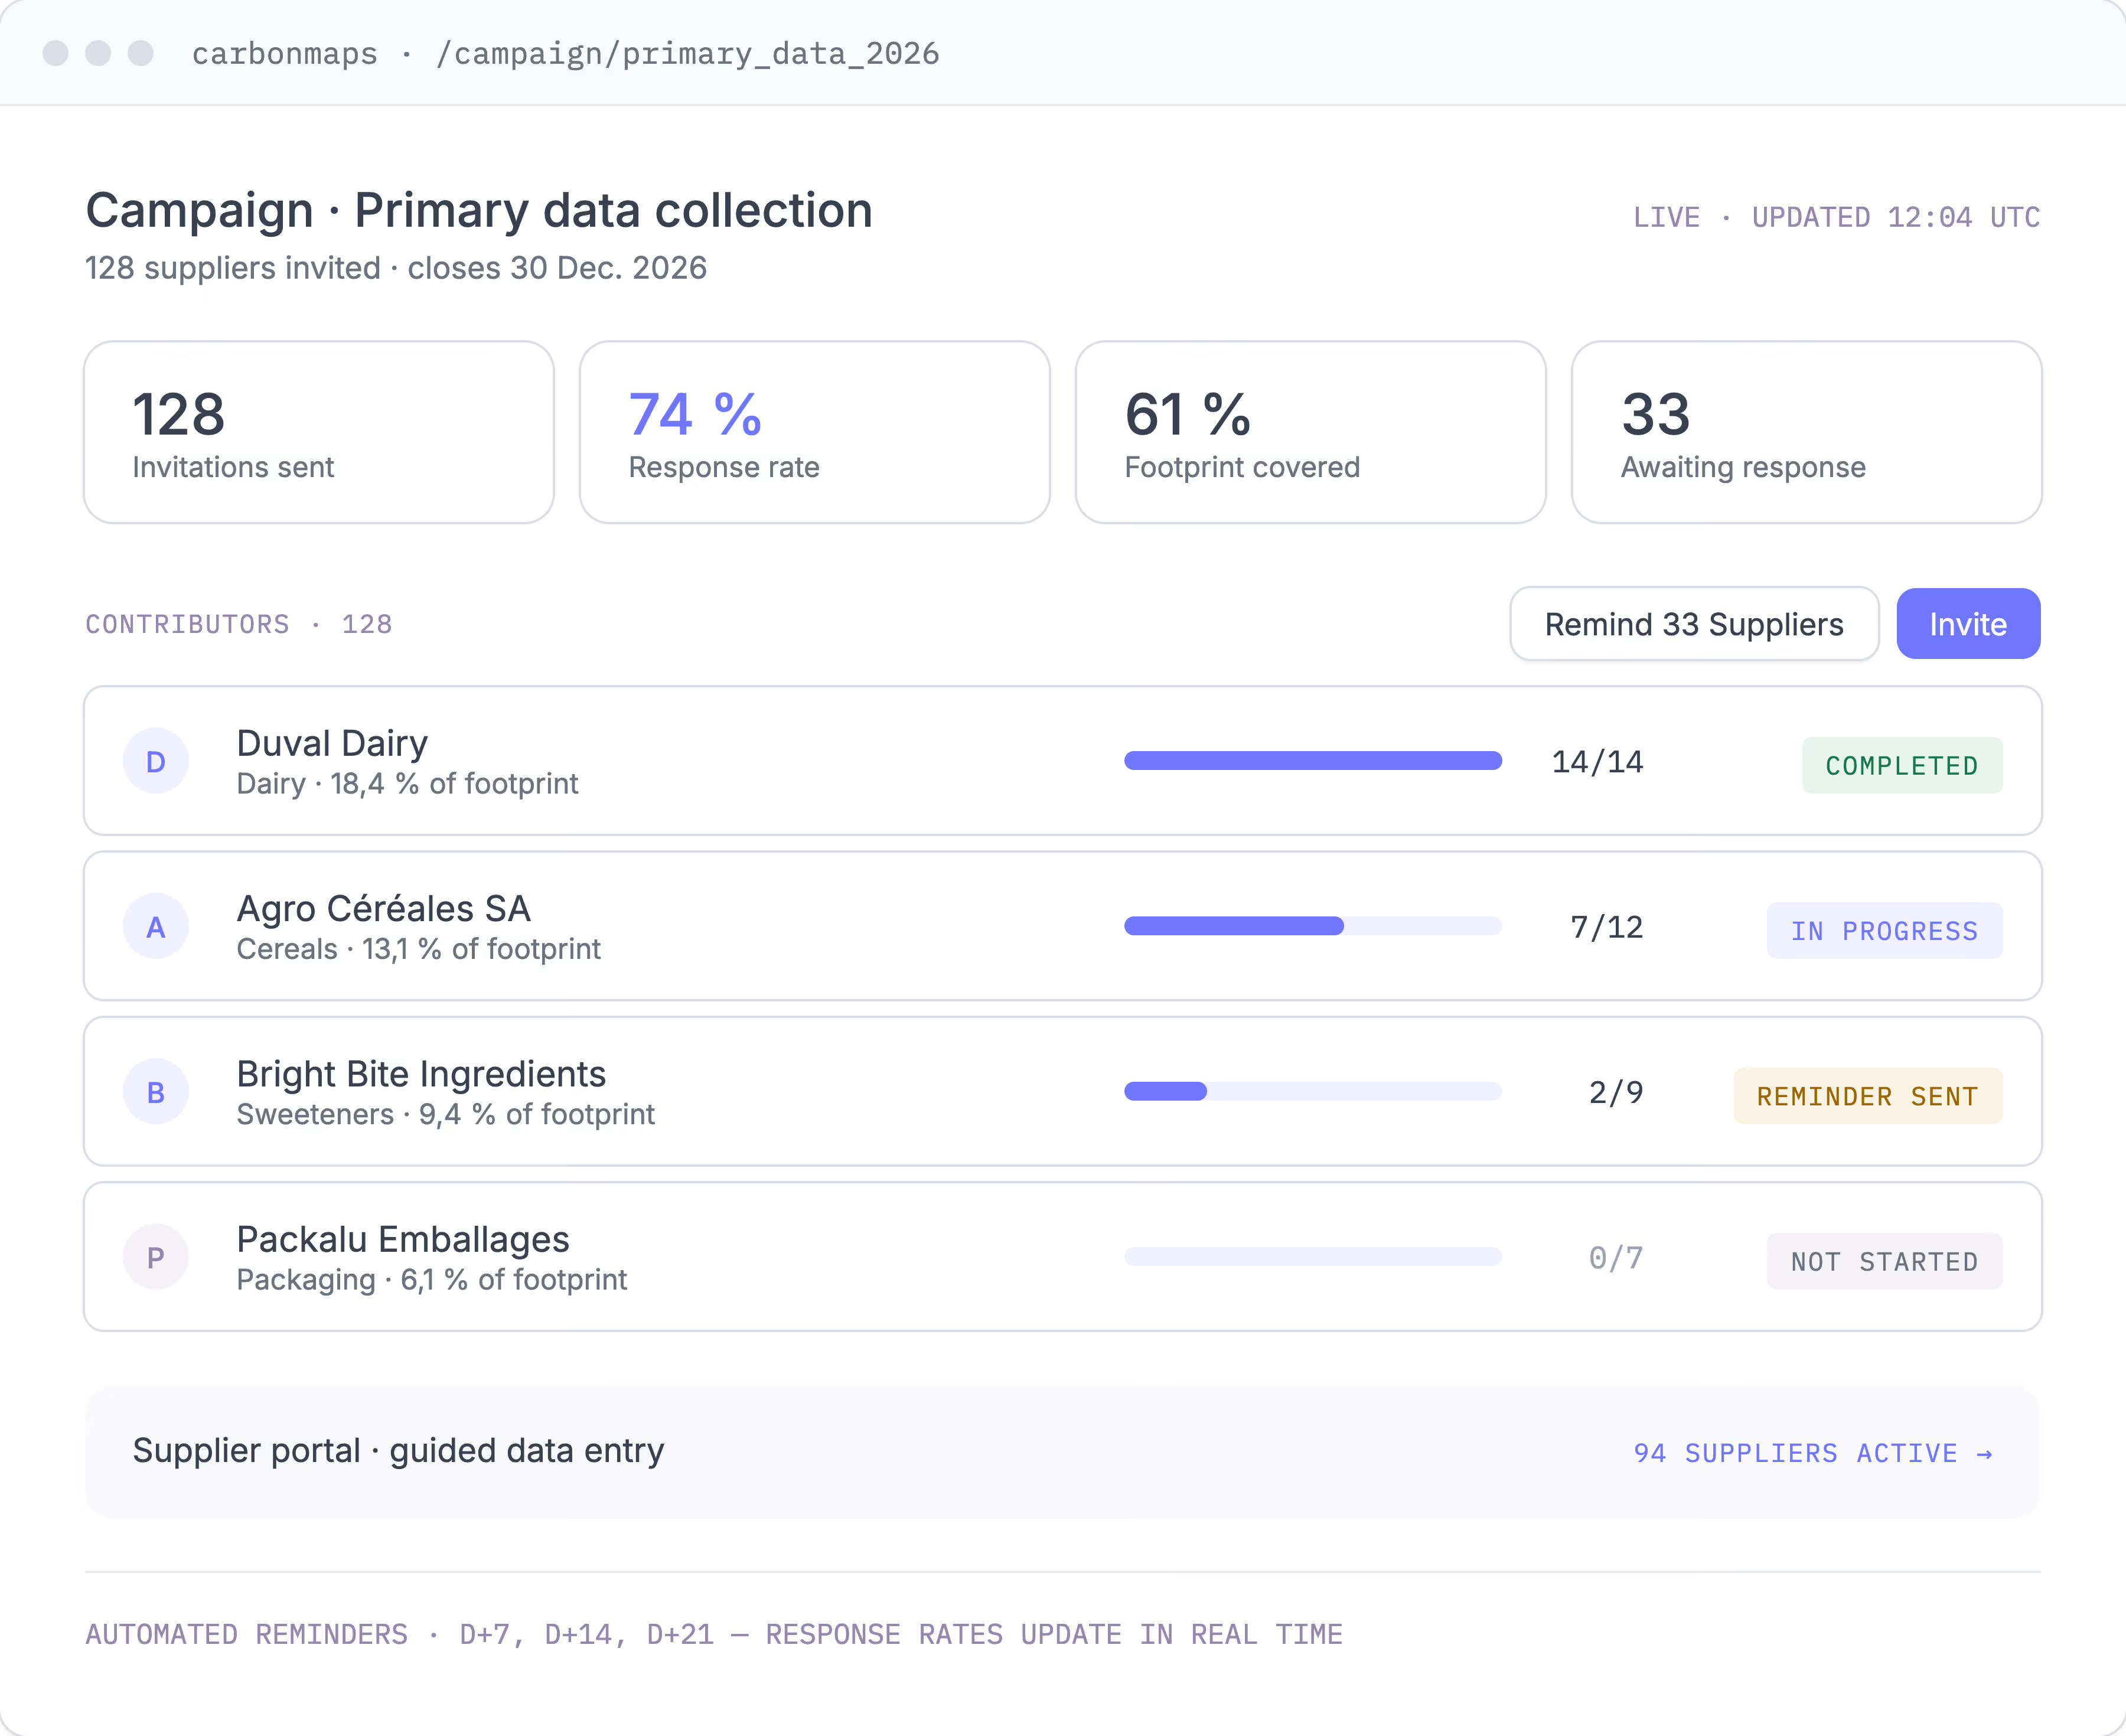
Run data collection campaigns without the manual chase.

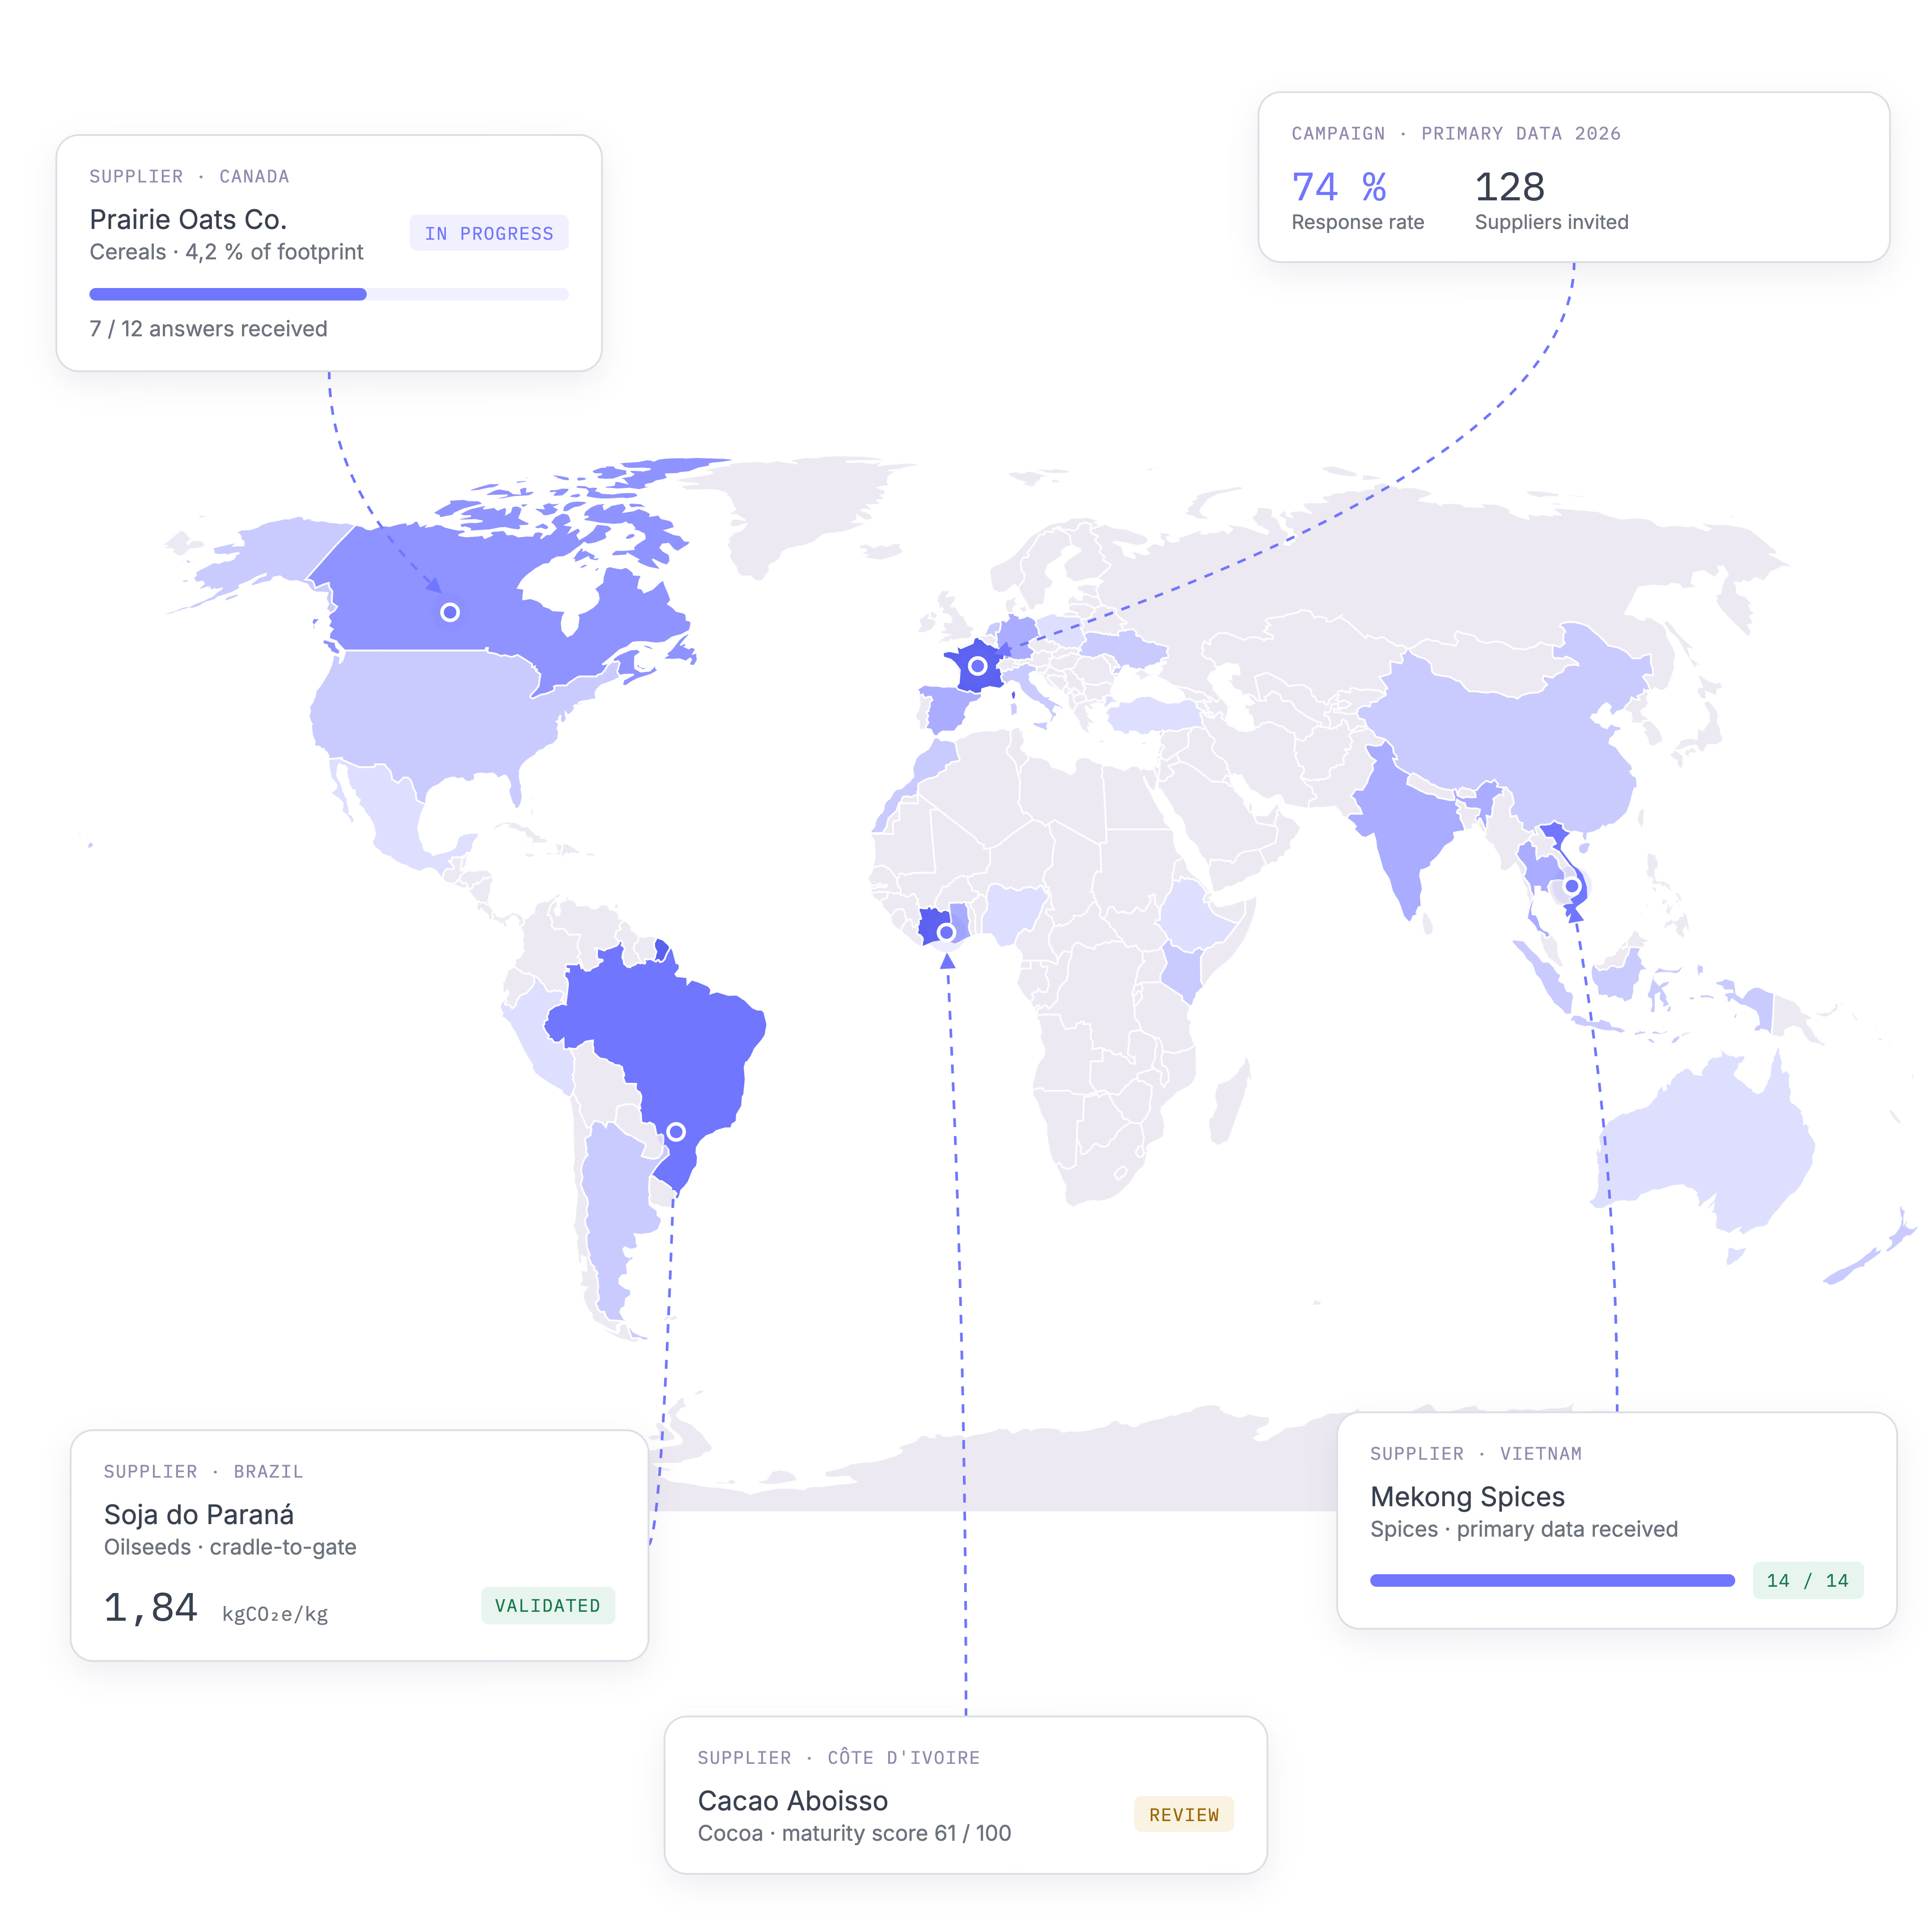
Invite suppliers, monitor their progress, and chase the ones who haven't answered all from one page. Suppliers get a dedicated portal with guidance to help them respond, so the work of data collection is distributed, not stuck on your desk.
Bulk supplier invitations and automated notifications
Dedicated supplier portal with built-in tutorials and guidance content
Real-time tracking of response rates and data coverage across contributors
03 · assess

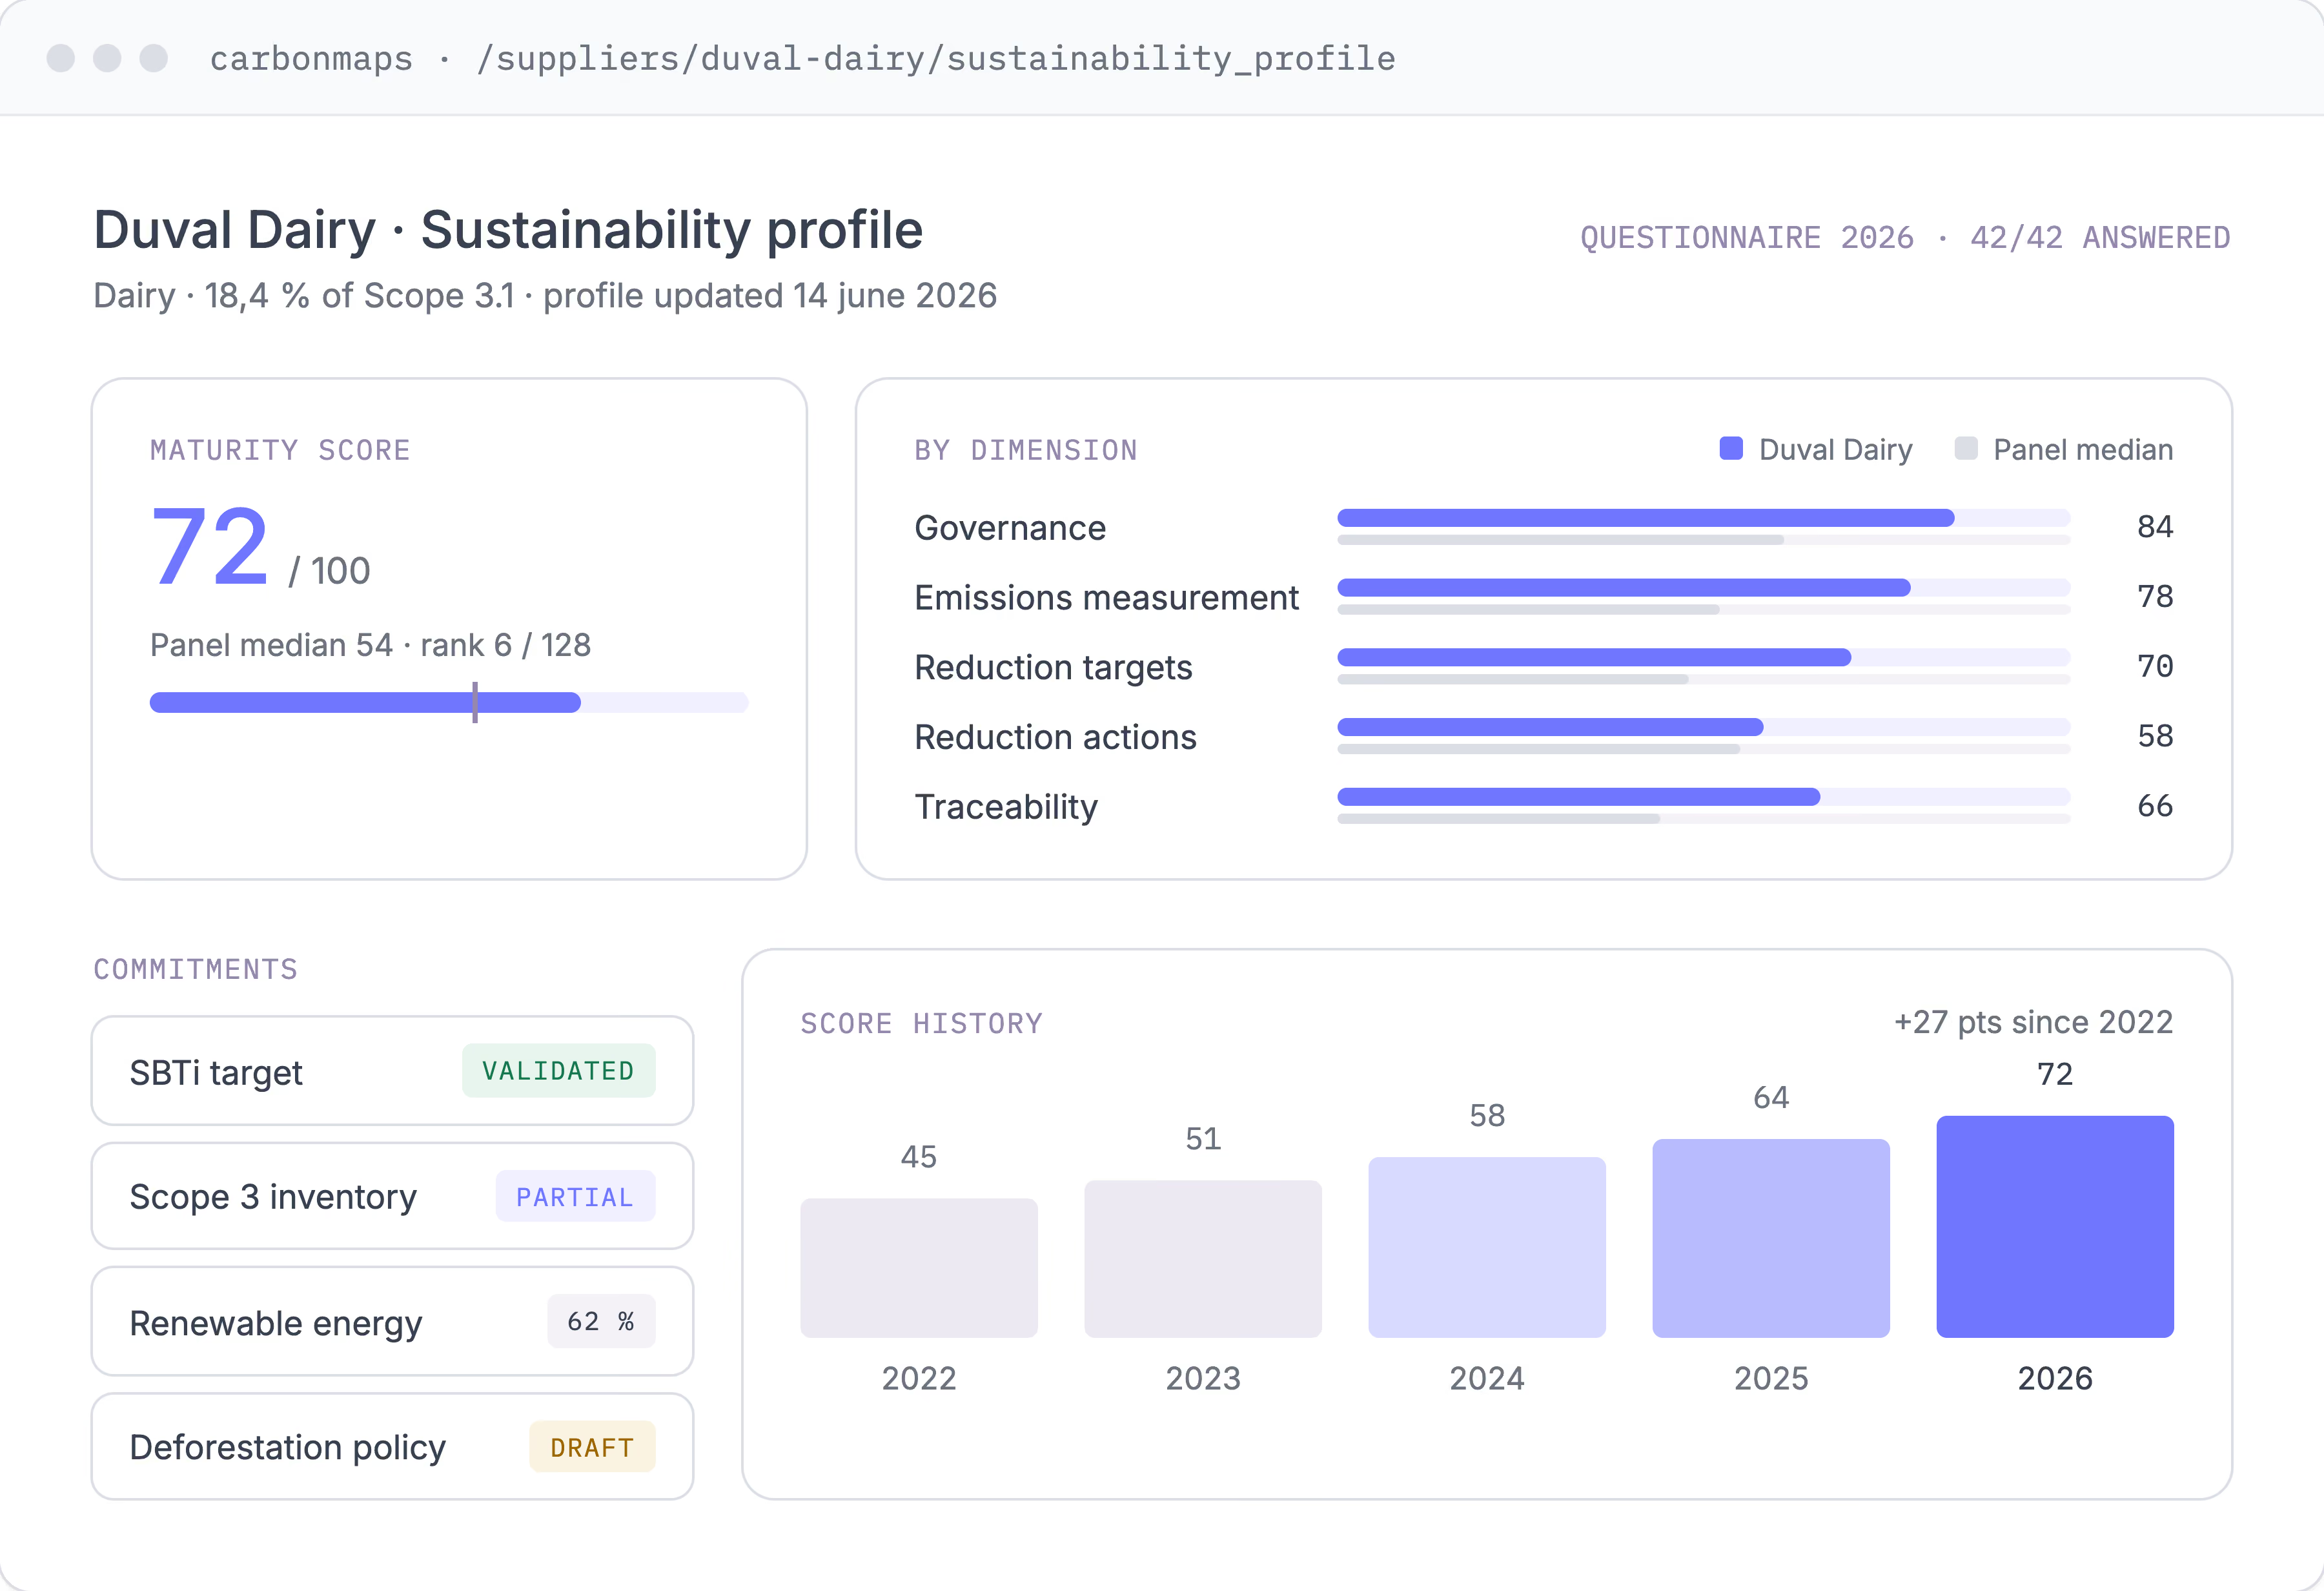
Understand where each supplier stands.

Collect ESG maturity, reduction targets, and sustainability commitments through a structured questionnaire, and then see where each supplier sits against your own sourcing strategy. Because your Scope 3 targets depend on theirs.
Supplier sustainability profile: ESG maturity, targets, and commitments
Maturity scoring, with response comparison across suppliers
Score history to follow how a supplier evolves over time
04 · Validate & integrate

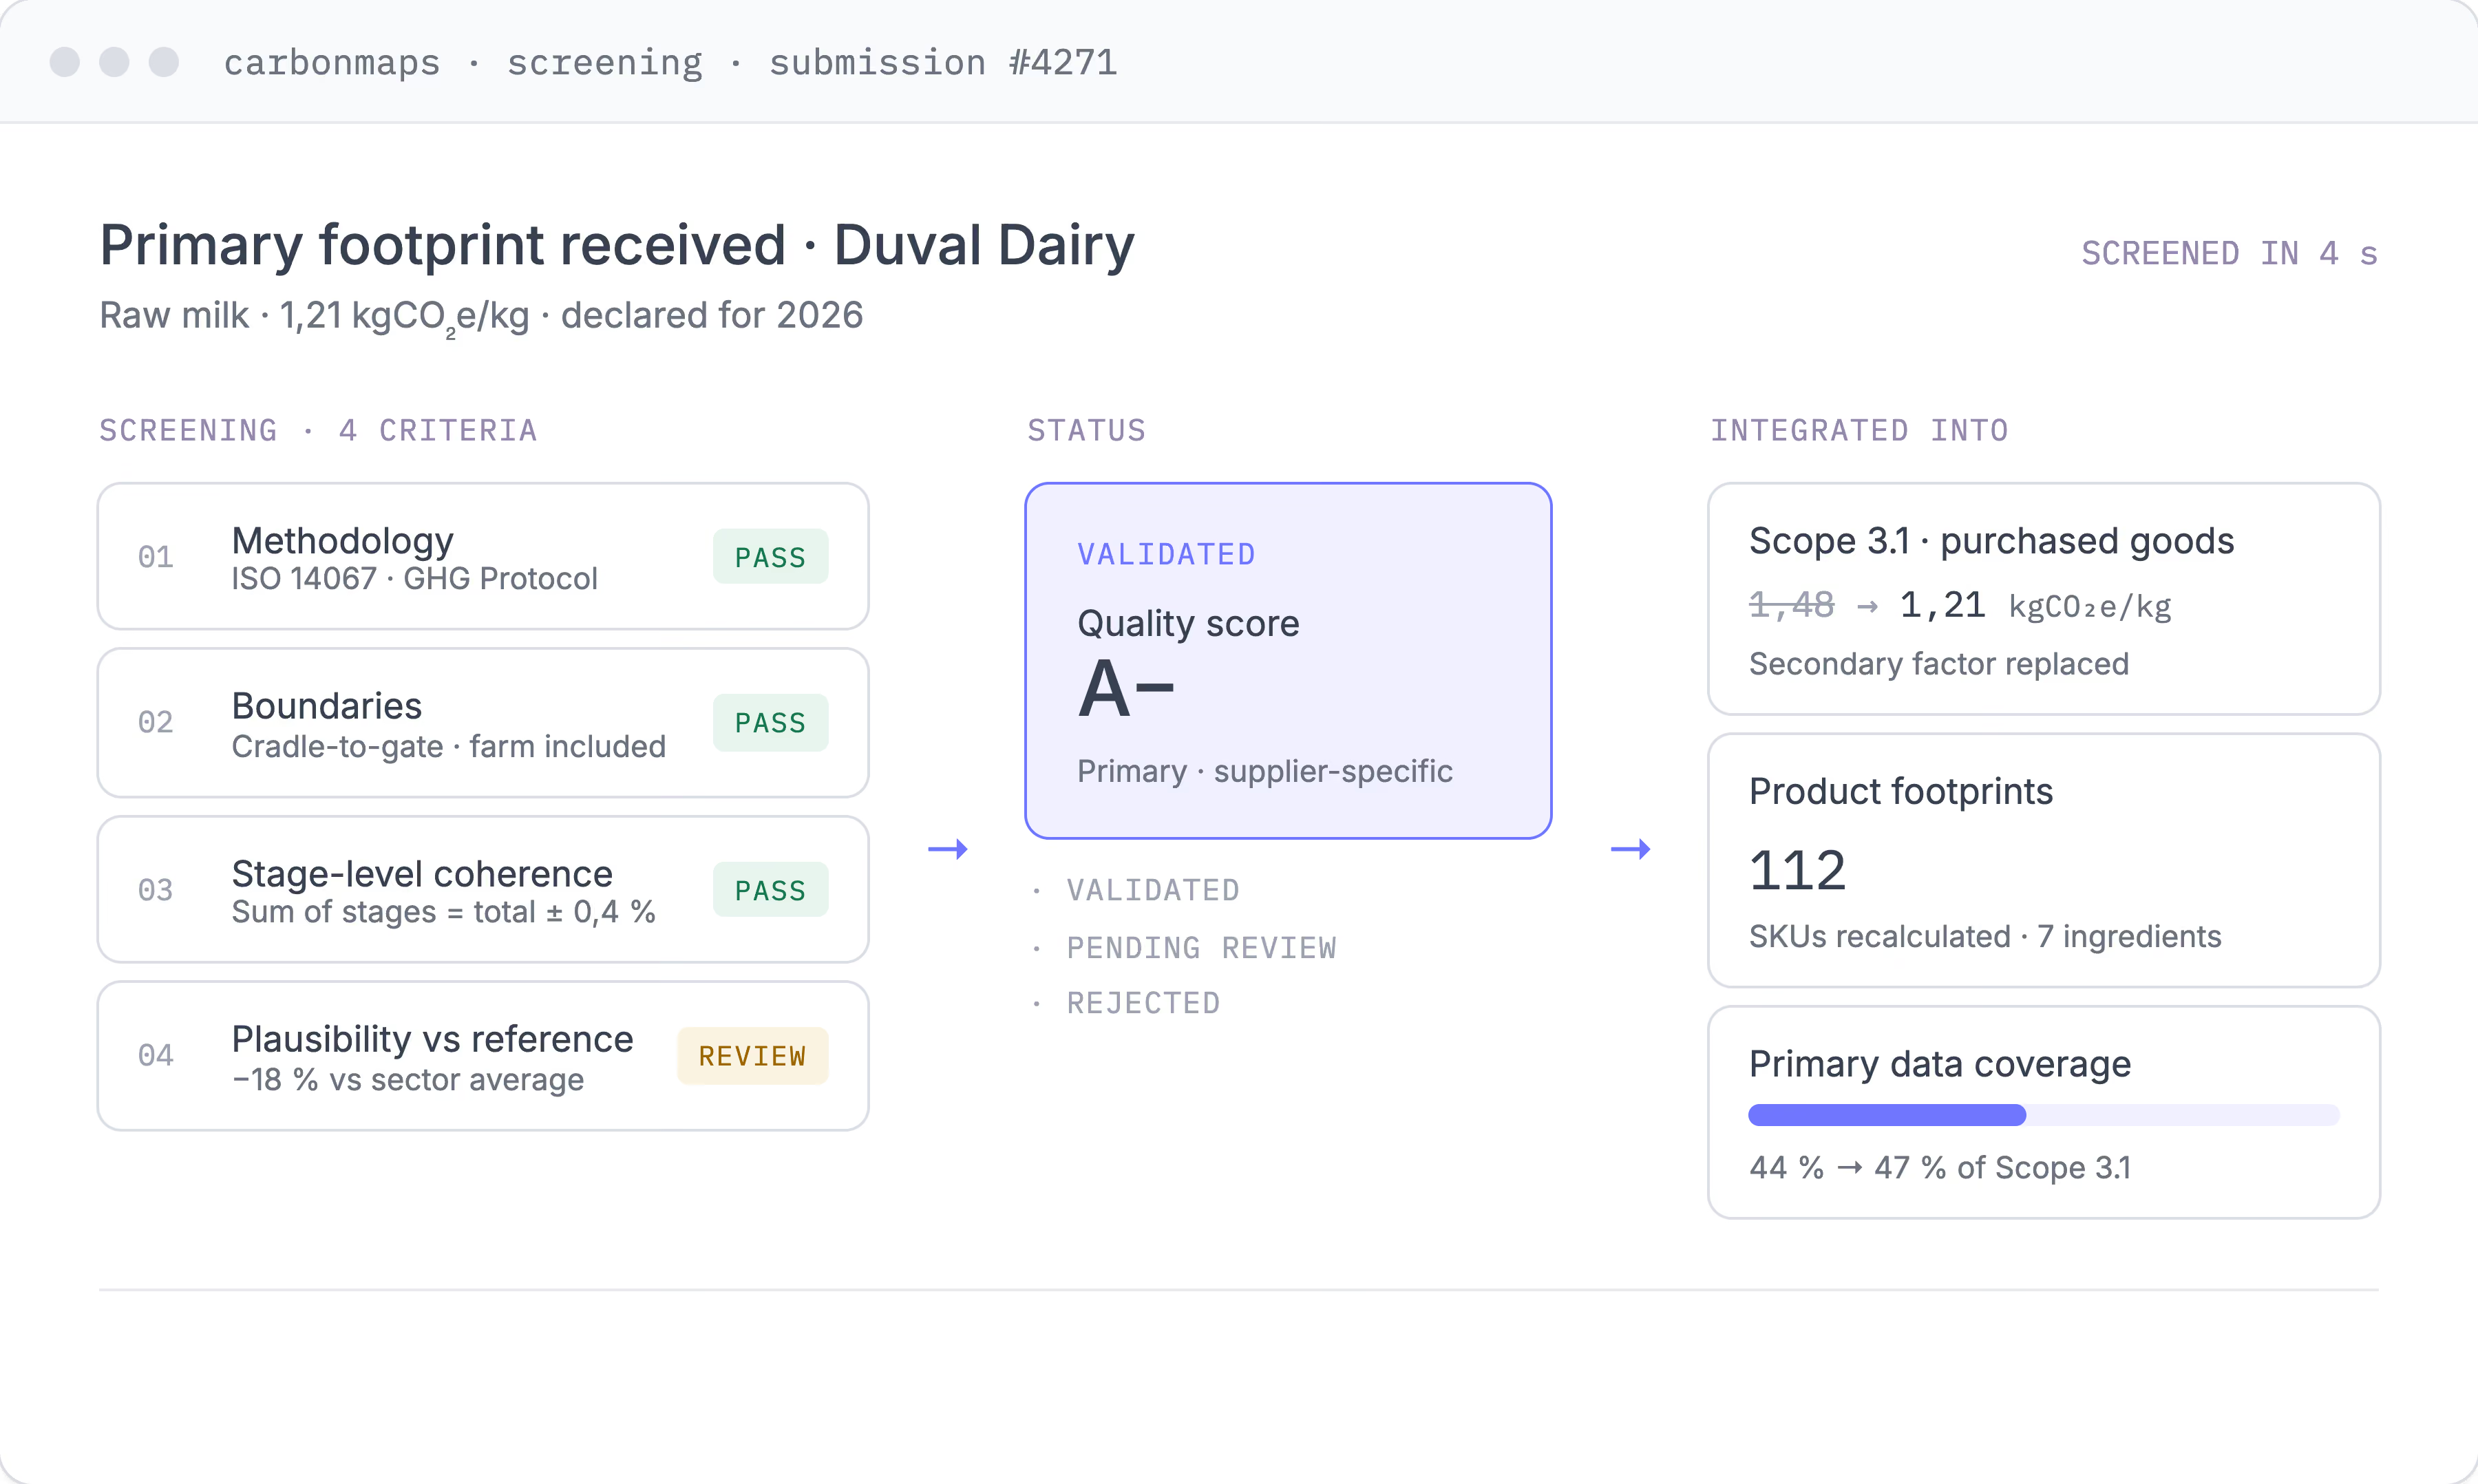
Primary data that flows straight into your footprint.

Collected footprints are checked against minimum criteria before they count — methodology, boundaries, and coherence — so you know what you're integrating. Validated data then feeds directly into your procurement and product calculations, because every Carbon Maps module runs on one connected model.
Screening checks on submitted footprints: methodology, boundaries, stage-level coherence
Clear validation statuses so you always know the quality of what you integrate
Validated primary data replaces secondary factors in your Scope 3.1 and product footprints
Automated data-quality assessment and integration
customer story

From ad hoc requests to structured supplier engagement.

"
With Carbon Maps, we've replaced time-consuming manual processes with a structured digital system that gives us real-time insight into our suppliers' sustainability maturity and initiatives. It has made our supplier engagement more consistent, more meaningful, and better aligned with evolving regulatory demands.
Ariane Jacoberger
Sustainability and Social Impact Manager · Solinest
Trust & compliance

Built on the standards your suppliers are already being asked to meet.

PACT
Pathfinder Framework V3, the cross-industry standard for exchanging product carbon data.
ISO 14040/44/67
Declared compliant with international standards for life cycle assessment principles and requirements.
TÜV Rheinland
Independent third-party validation confirming Carbon Maps' PCF calculation methodology meets the requirements of PACT V3 and the TfS PCF Guideline.
GHG Protocol
Corporate Value Chain (Scope 3) accounting, with Category 1 built from validated supplier data rather than spend-based estimates.
FAQ

What to know about supplier engagement for Scope 3

Practical answers to the questions food companies raise most when they start collecting primary data from suppliers.
Why can't I just use secondary data for Scope 3.1?
+
Secondary emission factors are enough to produce a corporate footprint, but they're built on industry averages, so they can't reflect what any individual supplier is actually doing. That has two consequences: your Scope 3.1 number stays imprecise, and you can't see the effect of any reduction action a supplier takes. Primary data from suppliers is what turns Scope 3 from a reported figure into a basis for decisions and joint reduction plans.
Most of my suppliers don't have a product carbon footprint. Can they still contribute?
+
Yes, this is the majority case, and the platform is designed for it. Suppliers don't need to be carbon-mature to provide usable data. Whatever they have — product and ingredient origins, certifications, the energy mix of their processing, commodity-level information — can replace an assumption in their estimated footprint and improve its accuracy. Suppliers who already have PCFs can share them directly; everyone else contributes what they can.
How do you keep suppliers from abandoning the questionnaire?
+
Three ways. Questions adapt to each supplier's profile, so they never wade through irrelevant fields. Suppliers receive the footprint estimates Carbon Maps has already calculated for the products they sell you, so they start from a concrete draft rather than a blank page. And a dedicated supplier portal provides tutorials and guidance so they can answer without hand-holding from your team.
How do I know the data suppliers send me is trustworthy?
+
Submitted footprints are screened against minimum criteria before they can be used — including declared methodology, system boundaries (a PCF can't be Scope 1 & 2 only), and coherence between stage-level values and the total. Each footprint carries a clear status so you always know the quality of what you're integrating, and you keep manual control over final validation.
How does supplier engagement connect to the rest of Carbon Maps?
+
It runs on the same data model as your corporate and product footprints. Engagement is built directly on the purchasing data behind your Scope 3.1 calculation, so prioritisation reflects your real emissions, and once supplier data is validated, it flows back into your procurement and product footprints automatically, with no double entry. Measurement, collection, and reduction live in one connected platform.
Who uses the supplier engagement module?
+
On the buyer side, it's typically the sustainability team and the procurement team working together: sustainability owns the measurement, procurement owns the supplier relationship. On the supplier side, it's usually a sales or sustainability contact. The module is built so both sides get value from the exchange.
SEAMLESS

A robust platform that simplifies Product Carbon Footprints and Life Cycle Assessments

Out of the box deployment requiring only basic information, such as product type or recipe, to get started
Seamless data synchronization with your IT systems to the platform via SFTP or APIs enabling faster time to value
A mockup of Carbon Maps platform showing importing product data from a source, then showing in a table the impact of various products like a croissant and chocolate croissant

See what good supplier engagement looks like in practice.

Blog Image

Supplier Engagement Strategy in the Food Industry

Read
arrow forward
Blog Image

Automating Supplier Sustainability Assessments for Smarter Engagement: Key Webinar Takeaways

Read
arrow forward
Blog Image

Automate your supplier sustainability assessment

Read
arrow forward