
If you're in the food business, you're in the emissions business.
The food sector is responsible for nearly 30% of global greenhouse gas emissions, yet most companies only track energy use or factory emissions. It’s a start, but it misses the biggest part of the picture.
A Corporate Carbon Footprint (CCF) goes further. It measures all greenhouse gas emissions linked to your business, from farm to fork, including suppliers, transport, packaging, refrigeration, and even product waste.
For most food companies, these indirect emissions across the value chain make up the majority of their footprint — often 80% or more. Without reliable data covering those upstream and downstream sources, it’s hard to see where your biggest risks and opportunities are.
This guide breaks down what a CCF includes, why it matters, and how to measure it in practice.
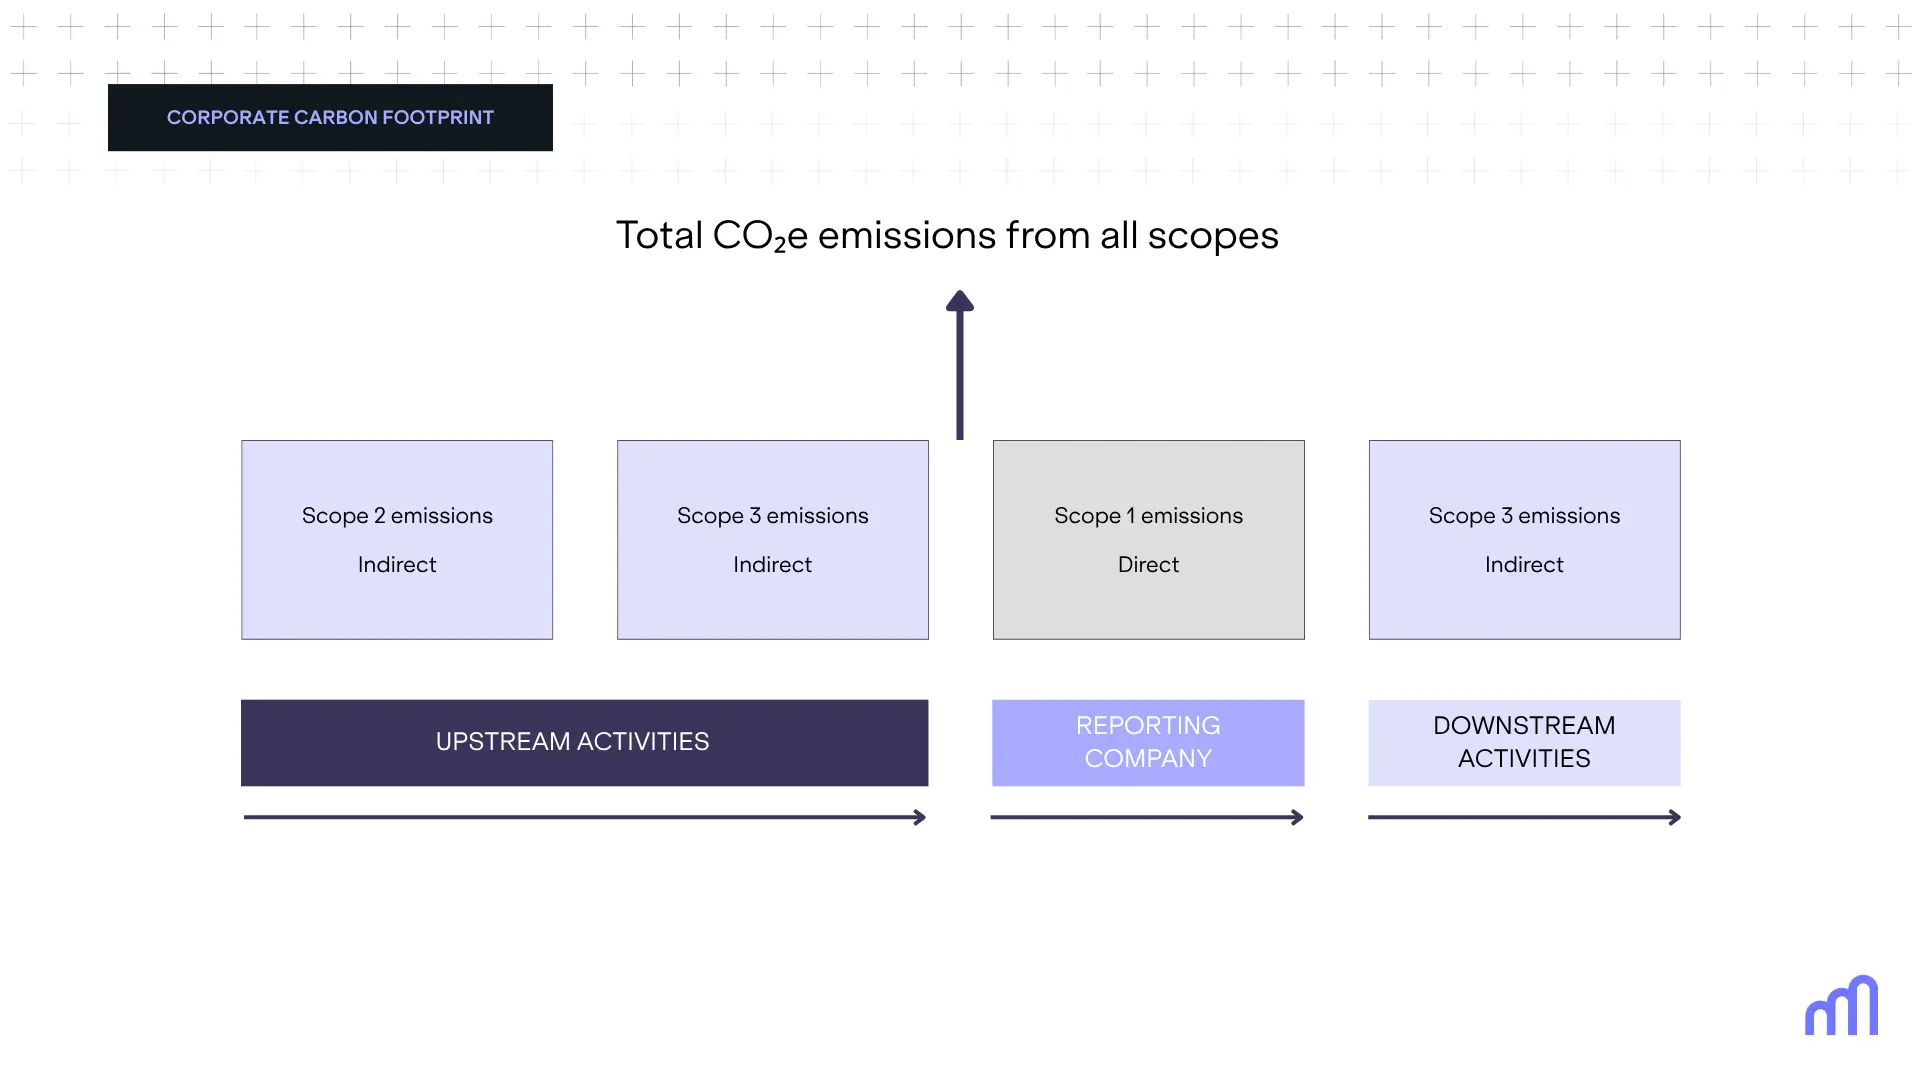
A Corporate Carbon Footprint (CCF) is the total greenhouse gas (GHG) emissions linked to your company’s operations and value chain over a set period (usually a fiscal year).
It covers the main greenhouse gases identified by the GHG Protocol: carbon dioxide (CO₂), methane (CH₄), nitrous oxide (N₂O), hydrofluorocarbons (HFCs), perfluorocarbons (PFCs), sulfur hexafluoride (SF₆), and nitrogen trifluoride (NF₃).
These emissions are grouped into three categories:
For food companies, Scope 3 is usually the largest and most complex part of the footprint, often accounting for 80% to 90% of total emissions. That’s because the most carbon-intensive stages, like agriculture, land use, and raw material production, typically happen upstream, outside your direct control. Add in packaging, transport, and distribution, and Scope 3 ends up covering the bulk of emissions for most food businesses.
Within Scope 3, one category in particular tends to dominate: Category 1 – Purchased Goods and Services. In the food and consumer goods sectors, this alone can make up 50% to 80% of Scope 3 emissions.
In food, a large share of emissions comes from upstream suppliers, through agricultural inputs, land use, and ingredient production.
If you’re buying from a supplier using intensive farming methods or ingredients linked to deforestation and land-use change, it can quietly drive up your footprint without showing up in your internal reports.
A Corporate Carbon Footprint helps connect those dots. It shows where most of your emissions are concentrated, across scopes, categories, and functions, so you can focus your efforts where they’ll have the biggest impact.
Carbon reporting is shifting from voluntary to mandatory. Regulations like the EU’s CSRD and the SEC climate rule in the US are raising the bar. Under the CSRD, for example, companies must disclose Scope 3 emissions if they’re material, which they almost always are in food.
Even beyond legal requirements, initiatives like the Science-Based Targets initiative (SBTi) expect full-scope reporting. Without data that includes upstream and downstream impacts, it's nearly impossible to meet credibility standards or track real progress.
Large retailers like Carrefour and Tesco are already requiring suppliers to report on their Scope 3 emissions. For many food businesses, carbon data is now part of basic supplier documentation, right alongside pricing, quality, and delivery terms.
Investors are increasingly evaluating emissions as a key component of business risk and long-term value. In response, some food companies now include carbon footprint trajectories in their debt covenants, linking sustainability performance directly to financial obligations. Companies with full-scope emissions data are better positioned to defend their strategy, meet these evolving expectations, and demonstrate credible progress toward their climate goals.
Consumers are also paying more attention to production methods and sourcing. A PwC survey found that 85% of global consumers are experiencing climate change firsthand and are actively prioritizing products that are sustainably produced and sourced. If you’re making climate commitments publicly, a carbon footprint helps back them up with actual numbers.
In 2024, UK supermarket Morrisons began testing a shift in freezer temperatures from –18 °C to –15 °C across 10 stores. The change cut energy use by up to 11% without compromising food safety or quality.
A study by Nomad Foods confirmed similar results, showing over 10% energy savings at –15 °C. Broader research estimated that this adjustment could cut supply chain energy use by 8.6% and reduce UK emissions by 17.7 million tonnes of CO₂ annually, equivalent to removing 3.8 million cars from the road.
This shows how carbon footprint analysis can uncover simple, cost-saving opportunities hidden in day-to-day operations. A full CCF helps you question assumptions, compare trade-offs, and make smarter choices that reduce emissions and costs.
Calculating a Corporate Carbon Footprint in the food sector requires working across a wide value chain, from direct operations to third-party suppliers. The GHG Protocol provides the structure most companies follow. It’s widely used across sectors and gives you a consistent way to collect, categorize, and report emissions.
Here’s what the process looks like in five steps.
Start by deciding what parts of your business the footprint will cover. There are two sets of boundaries to define:
GHG Protocol recommends transparency in both boundary decisions and data quality. If something is excluded, it needs to be clearly justified.
Map out all business activities that generate emissions across Scope 1, 2, and 3.
For Scope 3, use the GHG Protocol’s 15 categories to make sure you're not missing anything. It helps structure your reporting and draws attention to areas that are easy to overlook, like capital goods or end-of-life treatment for your products.
Further reading: Scope 3 Emissions: A Complete Guide to the 15 Categories
For each emission source, gather the activity data, the actual figures that describe what happened. That might include:
Scope 1 and 2 data often comes from utility bills, fuel receipts, or internal systems. Scope 3 data is harder to collect and usually depends on supplier input. If supplier data isn’t available, industry averages can be used as a starting point, but over time, the GHG Protocol expects data quality to improve.
Pro tip: Automating supplier assessments helps you get better Scope 3 data. In food, tackling Scope 3 emissions would be impossible without supplier engagement.
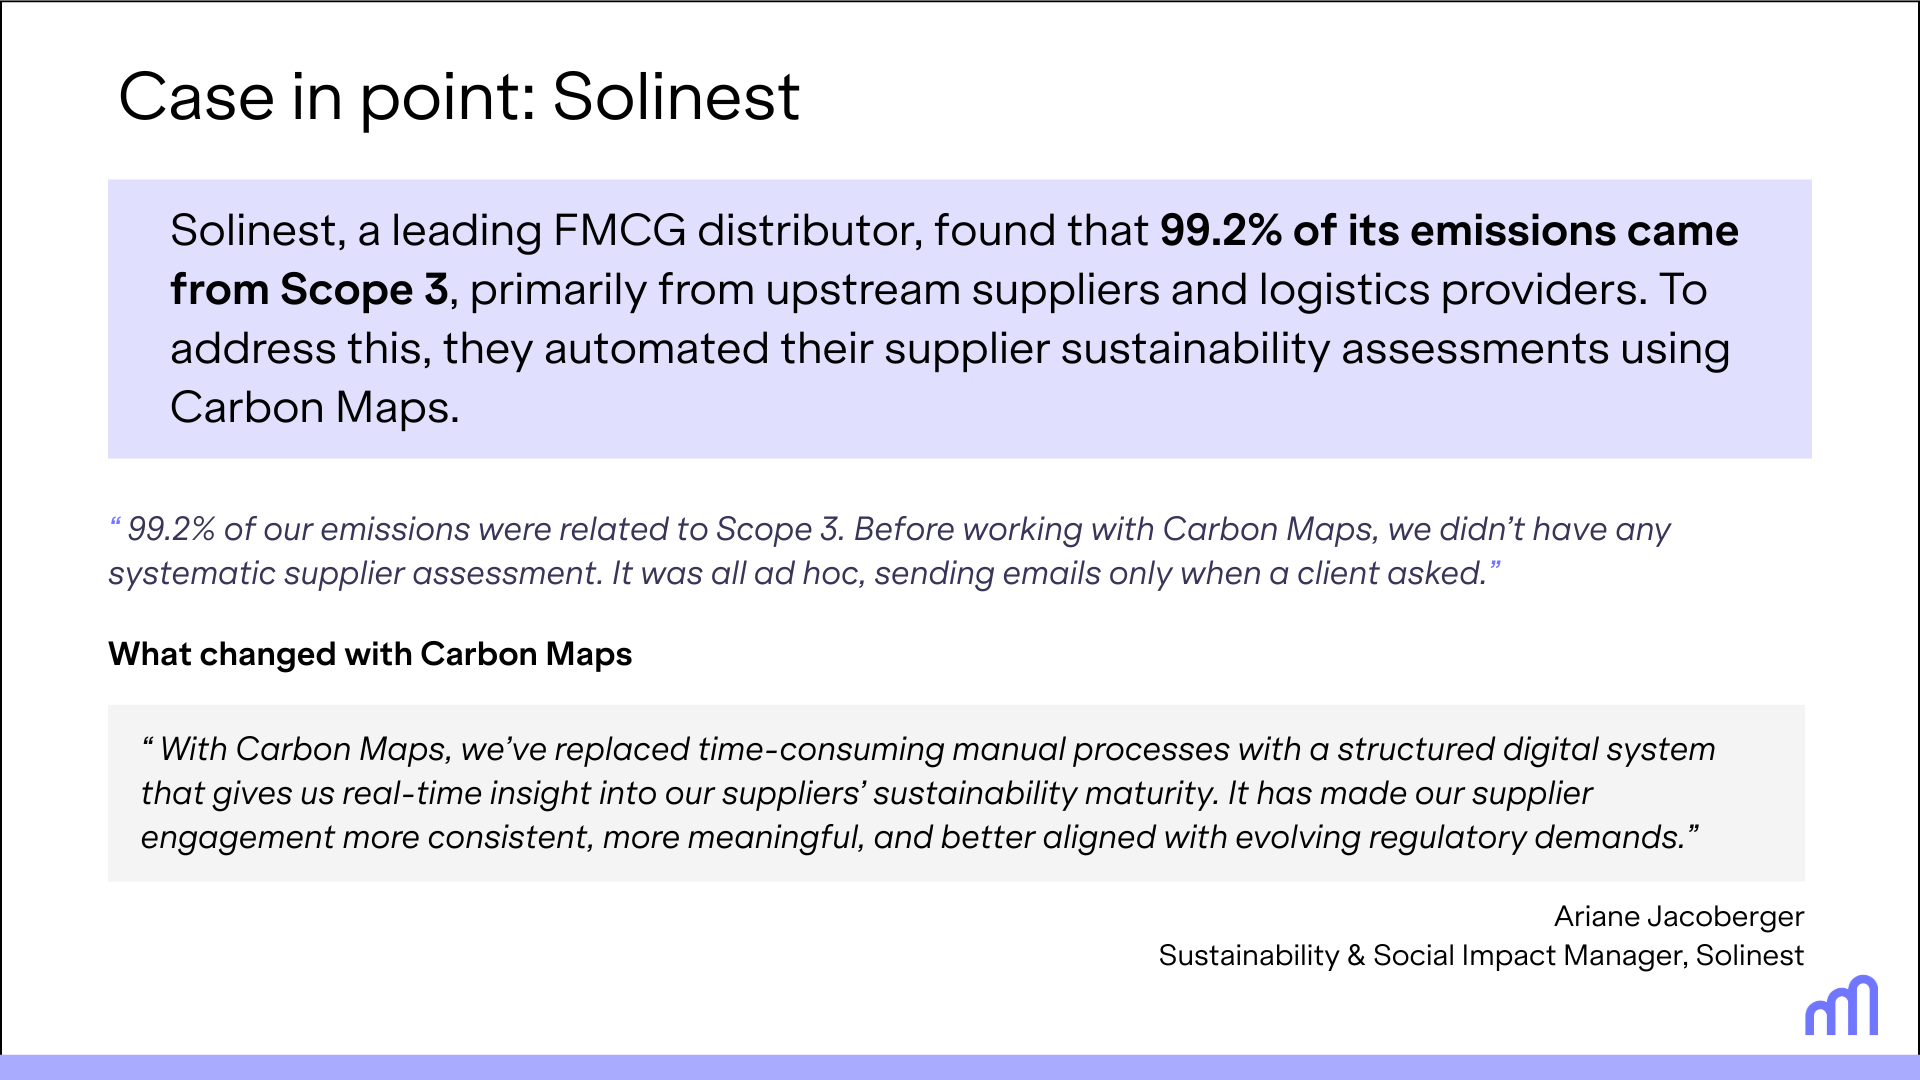
Read the full case study: Solinest Streamlines Their Supplier Sustainability Assessments
Once you've collected your activity data (e.g., liters of fuel consumed, kWh of electricity used, tons of ingredients purchased, or miles traveled by your delivery fleet), the next crucial step is applying the appropriate emission factors.
An emission factor is a coefficient that converts an activity into its equivalent greenhouse gas (GHG) emissions, typically expressed in kilograms of carbon dioxide equivalent (CO2e).
For UK-based companies, the UK Government GHG Conversion Factors for Company Reporting (published annually by the Department for Energy Security and Net Zero - DESNZ, formerly DEFRA) is the primary and recommended public database. For companies based in other European countries, key sources include ADEME's Base Empreinte (for France, and increasingly integrating broader European data), the European Environment Agency (EEA) for aggregated national or regional electricity grid factors, and commercially available, highly granular databases like Ecoinvent for comprehensive product life cycle assessment data across various sectors and regions.
Carbon Maps provides access to over 34,000 emission factors, giving you the granularity needed to identify hotspots and reduce emissions
To calculate emissions, simply multiply your activity data by the relevant emission factor. For example, to find emissions from your fleet's diesel consumption, you would multiply the total liters of diesel used by the corresponding diesel emission factor (kg CO2e/liter).
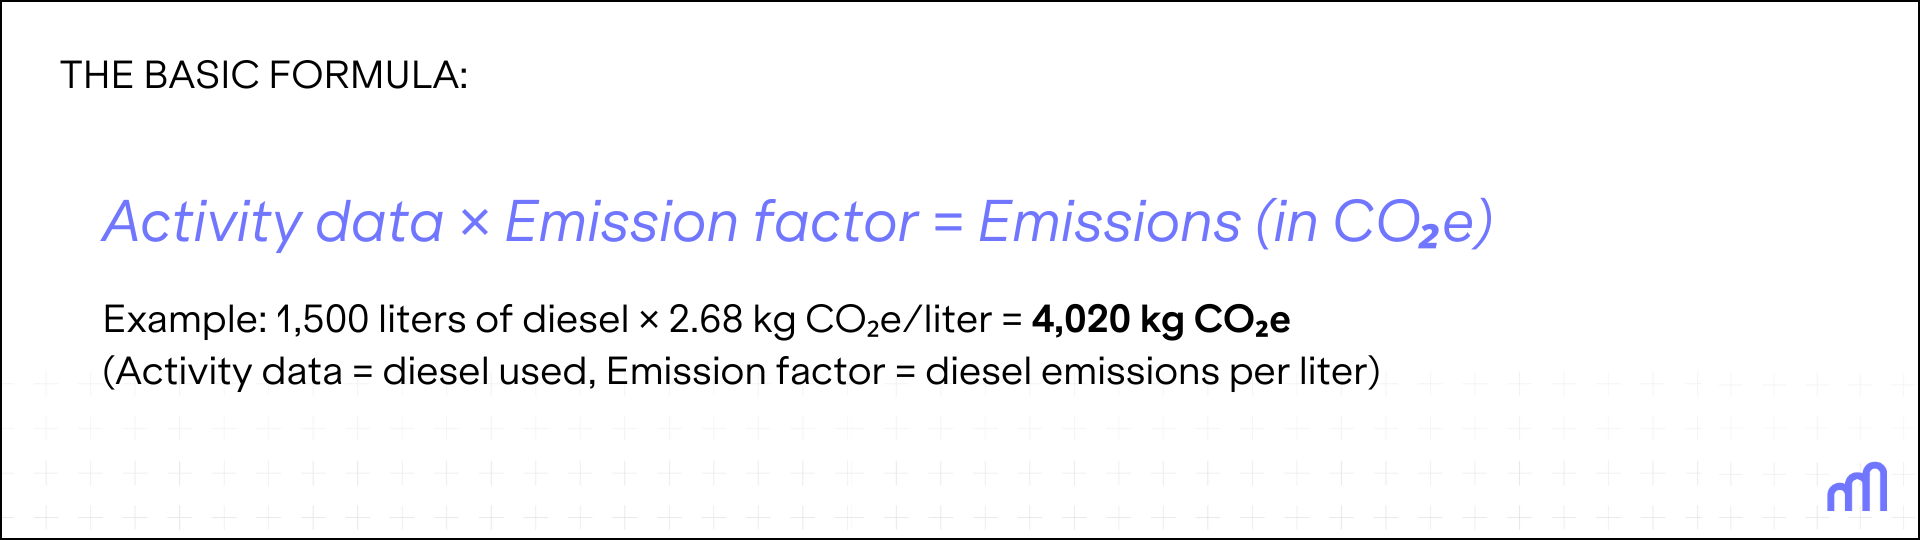
Remember to select factors that align with the specific activity and, where possible, choose location-specific or more granular factors to enhance the accuracy of your footprint.
Once you have the numbers, break them down by scope and by source, such as transport, energy, packaging, or purchased ingredients. This helps you pinpoint carbon hotspots and focus your reduction efforts where they’ll have the most impact.
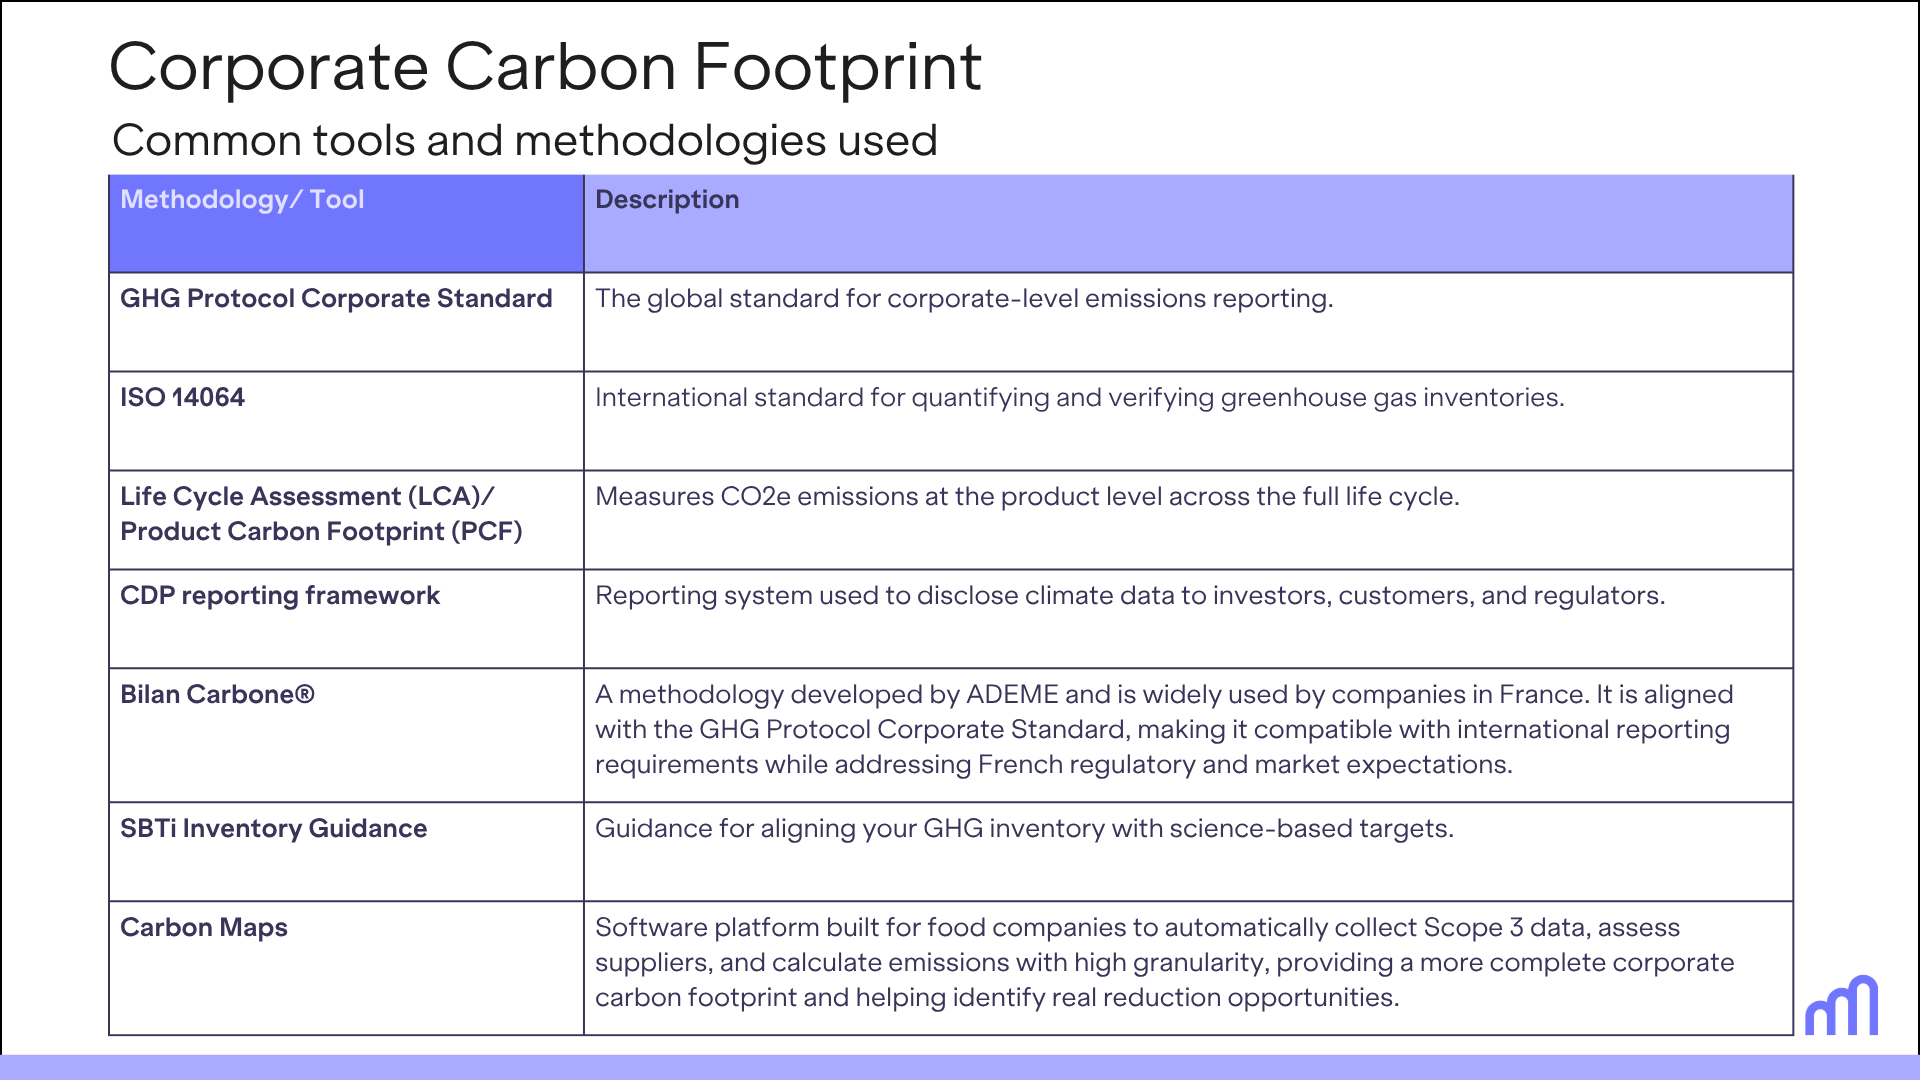
Note: Carbon Maps’ platform leverages the GHG Protocol Corporate Standard, ADEME’s Bilan Carbone®, and ISO 14064 methodologies to automate carbon‑footprint calculations across Scopes 1, 2, and 3. We’ve applied these assessments across multiple segments of the food industry — manufacturing, retail, and food service.
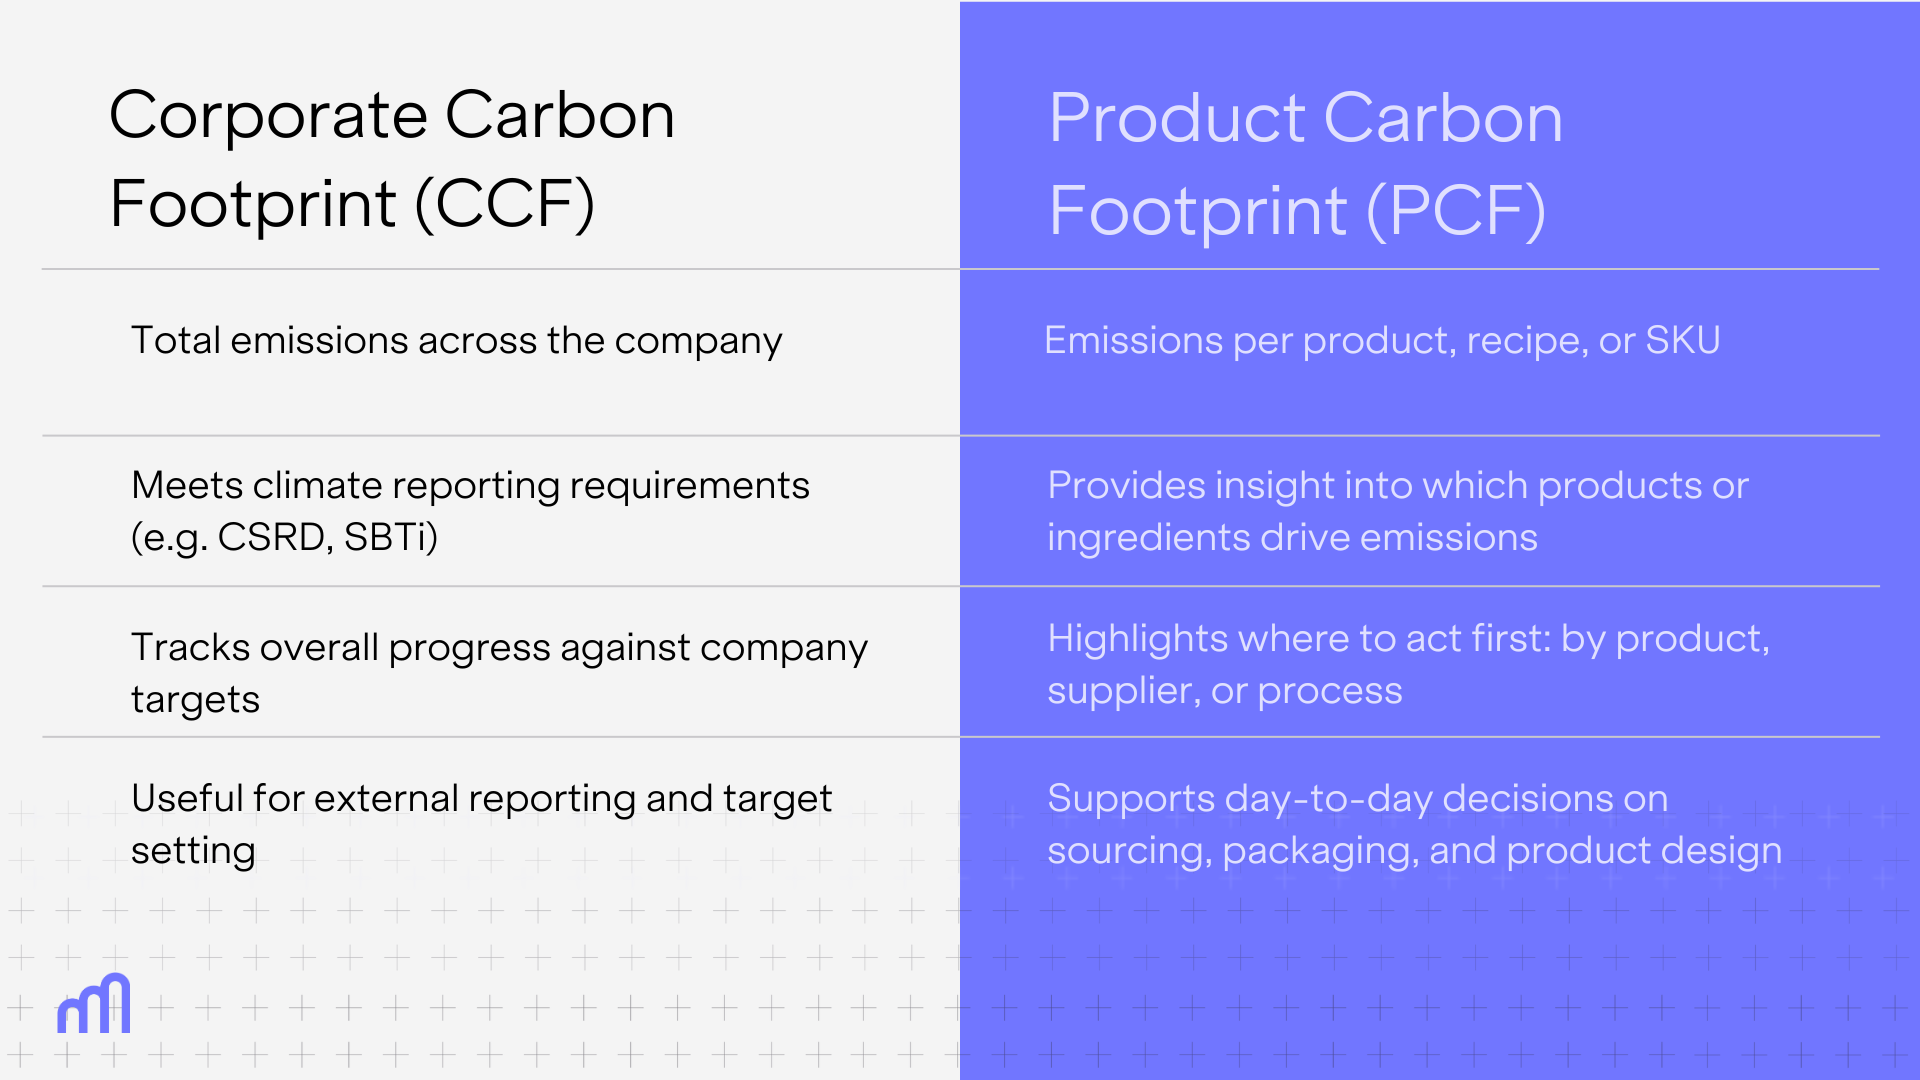
A Corporate Carbon Footprint shows your company’s total emissions, but it doesn’t explain what’s driving them. It won’t specifically pinpoint which products have the highest impact, which ingredients are tied to deforestation or land use change, or where your biggest reduction opportunities are.
To get that level of detail, many companies turn to Product Carbon Footprints (PCFs).
PCFs measure emissions at the product- or recipe-level, tracking carbon across ingredients, processing, packaging, transport, and end-of-life. This level of detail makes it easier to compare products, identify trade-offs, and decide where to act first.
Most companies stop at the CCF because it meets compliance requirements and fits standard reporting frameworks like CSRD, CDP, or SBTi. But when it comes to actionable reduction strategies or operational decisions, like incentivizing a supplier to switch to better farming practices or redesigning for a lower-carbon packaging, a company-wide footprint isn’t enough.
To reduce emissions in a meaningful way, you need both views: the high-level overview from your CCF and the granular insight from your PCFs.
Once you link product-level insights back to your corporate footprint, you start to understand where your Scope 3 emissions are really coming from, and what can realistically be changed. This makes your reduction targets more actionable and your reporting more grounded in how the business actually works.
Want to go deeper? Download the guide: How to Drive Corporate Carbon Reduction with PCFs
Carbon Maps helps food companies calculate both corporate and product-level emissions with the accuracy and detail needed for real-world decision-making.
With the platform, you can:
Book a demo

.png)

