


In the Fast-Moving Consumer Goods (FMCG) sector, most emissions don’t come from your operations. They come from your value chain (upstream suppliers, downstream logistics, packaging, product use, and disposal).
These are Scope 3 emissions. They’re complex, often hidden, and for most companies, they represent the lion’s share of the carbon footprint.
This guide explains what Scope 3 emissions are, why they matter for FMCG companies, and how to tackle them.
Scope 3 emissions are all indirect greenhouse gas emissions that occur throughout a company's entire value chain, including both upstream (before products reach you) and downstream (after your products are sold) emissions.
They’re different from:
Scope 3 emissions fall outside your direct control but are still closely linked to your business. Think of them as the carbon footprint of everything that happens before your raw materials arrive and after your products leave the shelf.
According to the GHG Protocol, Scope 3 can account for up to 90% of a company’s total emissions. That’s why managing it isn’t optional if you’re aiming for net zero. It’s where the biggest risks and the biggest opportunities lie.
For most FMCG companies, Scope 3 emissions make up 80% to 95% of total emissions, according to company disclosures and industry studies. In 2021, Nestlé reported that 95.8% of its footprint was Scope 3, for JBS, it was 91.4%, and for FMCG retailers like Solinest, it’s 99% of their entire carbon footprint.
These figures highlight a clear reality: real progress on climate targets depends less on what happens inside your company and more on the decisions you influence across your supply chain.
Here’s why it matters:
It’s important to understand that Scope 3 emissions are not a monolith. To make Scope 3 easier to understand and manage, the GHG Protocol breaks it down into 15 categories, spanning everything from raw materials to product disposal.
These are grouped into:
Companies are expected to assess all 15, but only need to report on those that are relevant. For any category you exclude, you’ll need to explain why.
These are emissions that come from the production of your business’s products or services
Emissions from the production of all goods and services that a company buys. For FMCG, this includes everything from raw agricultural products to packaging materials.
Emissions from the production of capital goods purchased by the company. These are physical assets used to produce other goods or services, such as equipment or buildings.
Emissions from producing and transporting fuels and energy that a company uses but does not own or directly control.
Emissions from transporting and distributing products before they reach the company, including third-party logistics services you don't directly control.
Emissions from treating and disposing of waste that a company creates in its day-to-day operations.
Emissions from employee business travel in vehicles not owned or controlled by the company, such as commercial flights or rental cars.
Emissions from employees traveling between home and work, using any means of transport not owned by the company.
Emissions from the operation of assets leased by the company (not already included in Scope 1 and 2), like rented warehouses or offices.
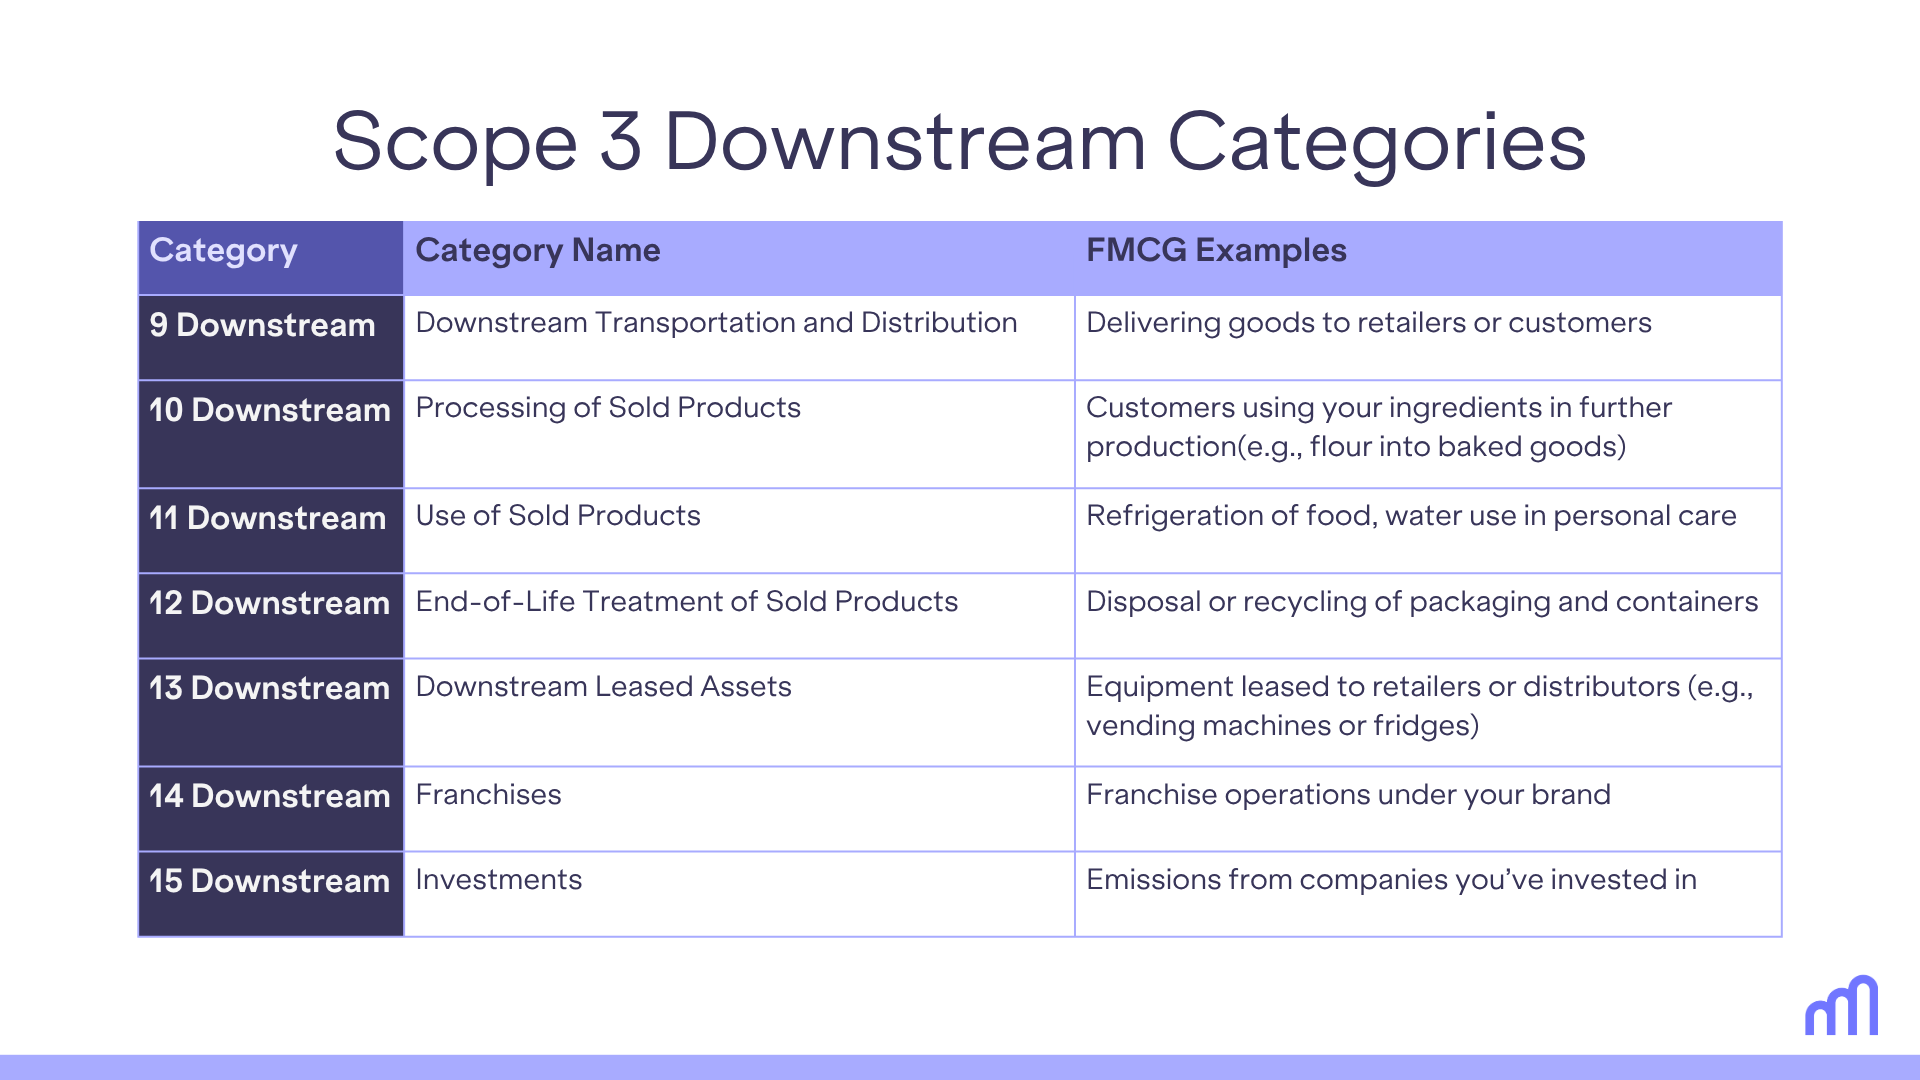
Emissions that come from use and disposal of your products and services.
Emissions from transporting and distributing products after they leave the company, such as shipping finished goods to customers.
Emissions from further processing of intermediate products you sell. This primarily applies to FMCG companies that sell ingredients or components to other manufacturers.
Emissions from consumers and businesses using your products throughout their lifetime, such as energy consumed by appliances or vehicles. This is often the largest downstream category for many FMCG products.
Emissions from disposing of or recycling products after customers are done with them, including packaging waste management.
Emissions from assets you own but lease to others, such as retail space or equipment.
Emissions from activities of franchisees operating under the company’s brand.
Emissions from companies you invest in, including subsidiaries, joint ventures, and financial investments.

Calculating Scope 3 emissions involves mapping your value chain, collecting activity data from suppliers, partners, and customers, and applying appropriate emission factors.
For FMCG companies, the goal isn’t to calculate everything at once; it’s to build a reliable picture over time, starting with your biggest impact areas.

The GHG Protocol offers several calculation methods, depending on the quality of data you have:
Pro tip: To make this process faster and error-free, consider using a platform like Carbon Maps. It automates calculations, provides access to over 34,000 emission factors, visualizes your data with dashboards, and makes it simple to collect primary data from your suppliers through an automated supplier assessment feature.
Tracking Scope 3 emissions is hard, especially in a sector with complex supply chains, short product cycles, and hundreds of suppliers. Here are some of the biggest barriers FMCG companies face:
Data availability and quality
Getting accurate, detailed data from suppliers is tough. Many suppliers don’t track their emissions or don’t have the systems to share the data you need. Estimates based on industry averages can be helpful, but they reduce accuracy.
Low visibility beyond direct suppliers
Most emissions come from suppliers you don’t deal with directly, like raw material producers or ingredient processors. Tracing ingredients or materials back through multiple tiers of the supply chain (especially in food and personal care) is difficult and resource-intensive.
Complex supply chains
FMCG value chains involve multiple actors across geographies and product types. That makes it tough to map where emissions are coming from or where to focus reduction efforts.
Low engagement from suppliers
Even when you request data, suppliers may be unresponsive or unsure how to provide it. Without clear incentives or guidance, it’s hard to get consistent participation.
Want to engage suppliers more effectively? Read: Automating Supplier Sustainability Assessments for Smarter Engagement
Your Scope 3 footprint depends heavily on what you sell. Different product categories—like food, personal care, and household products—have distinct value chains, with different emissions hotspots and data challenges.
Understanding these differences helps teams prioritize where to act.
Focus on the categories that matter most: usually ingredients, packaging, logistics, and product use. These are where the bulk of your emissions are, and where better data has the most impact.
Use tools that help collect, organize, and analyze data from supplier engagement to product-level emissions calculations. You reduce manual errors and access insights faster.
Suppliers hold most of the data you need, so make it easy for them to share it. Provide clear templates or guidance, and focus first on your top suppliers with the highest volume or impact.
Carbon Maps analyses show about 50% of a food company’s emissions are tied to its top 10–20 suppliers.
You won’t get perfect data in the first round. Start with what you have, then improve over time. Regular updates, annual reviews, and clearer expectations each year can steadily raise data quality.
Integrate emissions into procurement workflows. Ask for carbon intensity data in RFPs, give preferred status to low-emission suppliers, and treat carbon like cost when comparing options.
Learn how CSR and Procurement teams can team up to cut Scope 3 emissions
Carbon Maps is a SaaS decarbonization and sustainability platfom for the food industry that helps companies measure, manage and reduce Scope 3 emissions at the product level, where the bulk of their impact lies.
Engage suppliers and collect primary data through automated supplier sustainability assessments. You get accurate product-level data that reflects your actual supply chain, without chasing spreadsheets or emails.
Purchased goods (Category 1) are often the biggest and most complex source of Scope 3 emissions. Carbon Maps breaks this down by ingredient, helping you understand the true carbon footprint of your raw materials.
Get a category-specific breakdown: by ingredient, packaging, transport, or product use, so you can prioritize actions where they’ll have the biggest effect.
The eco-design feature lets you model the emissions impact of changing suppliers, ingredients, packaging, or transport. See the difference in real time, and make choices that align with your climate goals.
Book a demo

.png)
