


One of Carbon Maps' clients recently found a 300% error in their Scope 3.1 emissions, the category covering purchased goods and services and typically the largest line item on a food company's carbon footprint. The cause wasn't bad intent or sloppy work. It was the emission factors themselves: generic, spend-derived figures with only a loose relationship to what the company actually bought.
That error is not an outlier. It's the predictable result of applying a costing logic, dollars spent multiplied by an industry average, to a value chain where two ingredients with identical price tags can carry radically different footprints. For most industries, spend-based accounting is a reasonable shortcut. For food and beverage, it's a structural mismatch, and the gap is starting to show up in board reports, retailer scorecards, and CSRD assurance findings.
This article makes the case for activity-based accounting as the default for food companies. Not as an aspirational upgrade to attempt someday, but as the only approach that produces numbers a sustainability team can actually act on.
Spend-based carbon accounting is simple by design. You take procurement spend in a given category, multiply it by an emission factor expressed in kg CO2e per euro or dollar, and get an estimate. Those emission factors typically come from environmentally extended input-output (EEIO) models like EXIOBASE, which map economic sectors to average emissions intensity.
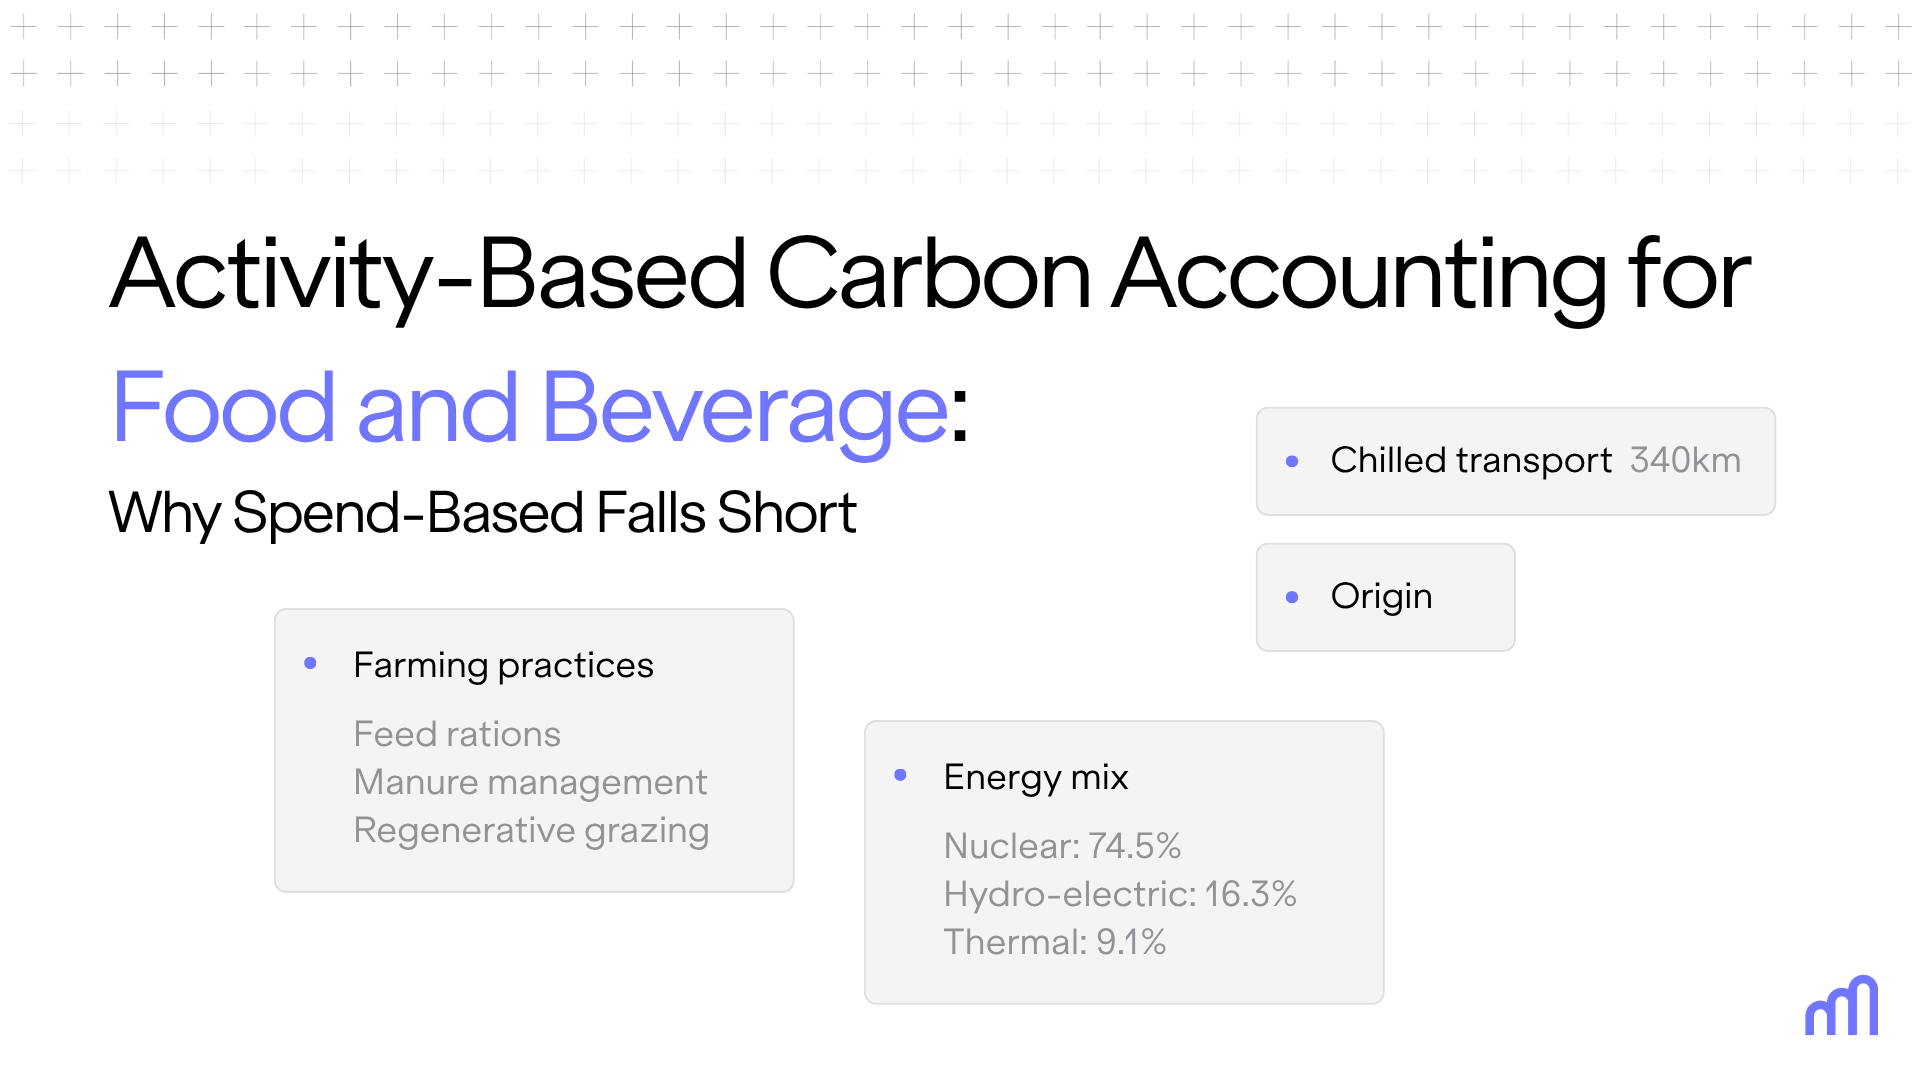
The logic holds reasonably well for categories like professional services or IT equipment, where spend correlates loosely with resource use. It collapses in agriculture. Consider two liters of milk purchased at the same price: one from a pasture-based, regionally sourced dairy; the other from an intensive operation reliant on imported soy feed. Their financial cost to the buyer might be nearly identical. Their emissions are not. The difference can run several-fold depending on feed sourcing, land use, and methane management.
Spend-based models can't see that difference, because they were never built to. They average across an entire economic sector, blending low-impact and high-impact production methods into a single euro-denominated coefficient. The result is a footprint that looks precise, with clean numbers and a tidy total in tonnes of CO2e, while actually obscuring the operational reality underneath it. A sustainability lead reading that number has no way to tell which suppliers, which ingredients, or which sourcing decisions are actually driving the total.
Price volatility compounds the problem. Because spend-based estimates are indexed to what you paid, not what you consumed, a supplier price increase alone can move your reported emissions up or down, with zero change in what was actually produced or shipped. That's not a minor footnote. It means year-over-year emissions trends calculated this way can reflect commodity markets more than decarbonization progress.
The Scope 3 categories most affected by this gap are the ones that matter most for food companies: 3.1 (purchased goods and services), 3.3 and 3.4 (fuel and transportation), 3.5 (waste), and several others where generalist carbon accounting tools default to spend-based estimates because activity data is harder to model. For a typical food business, these categories routinely account for 80–90% of total emissions. Getting them wrong doesn't produce a slightly-off number — it produces a footprint that's wrong where it matters most.
The consequences compound from there. A reduction target set against a spend-based baseline can be met or missed for reasons that have nothing to do with actual emissions performance: a supplier renegotiation, an ingredient price spike, a currency shift. If a key ingredient's market price jumps 15% next quarter with no change in how it's farmed, a spend-based footprint will show a matching jump in emissions. The team then spends its next planning cycle explaining a number that never reflected reality in the first place, instead of working on the sourcing changes that would.
Reduction initiatives suffer the same distortion. Told that "purchased goods" is the largest spend-based category, a team's natural response is to target spend: renegotiate contracts, consolidate suppliers, cut discretionary purchases. None of that reliably cuts emissions, because spend was never the variable driving them. Meanwhile the sourcing decisions that would actually move the number, like switching a supplier's feed source, shortening a transport route, or choosing a lower-impact packaging format, stay invisible, because the accounting method can't resolve down to that level.
This also plays out in how the number gets used externally. When a retailer asks a supplier to justify a carbon claim on a private-label product, or an auditor asks how a Scope 3.1 figure was derived, "we multiplied our ingredient spend by a sector-average factor" is a materially weaker answer than "we modeled the specific ingredients, origins, and production methods in this product." The first invites follow-up questions the team can't answer. The second is the answer.
Activity-based accounting starts from physical reality instead of financial proxies. Instead of "how much did we spend on packaging," it asks "how many kilograms of which packaging material, sourced from where, produced how." Each activity, whether that's liters of fuel burned, kilowatt-hours consumed, or kilograms of a specific ingredient sourced from a specific region and production method, is matched to an emission factor built for that exact activity, not for an entire economic sector.
For food specifically, this means emission factors that vary by farming practice, not just by commodity category. Regeneratively grown wheat and conventionally grown wheat are not treated as interchangeable. Air-freighted produce and sea-freighted produce are not folded into the same transport average. A footprint built this way reflects what was actually sourced, processed, and shipped, which is the only version of the number that can actually guide a reduction strategy, because it shows which specific choices move the total.
In practice, this means building a footprint recipe by recipe rather than category by category. Take a fruit yogurt: Carbon Maps' methodology calculates its footprint by taking each ingredient's share of the product's net weight and multiplying it by an emission factor specific to that ingredient, then summing the results. For example, milk at 75% of the recipe and an emission factor of 1.20 kg CO2e per kilogram contributes 0.90 kg CO2e to each kilogram of finished yogurt; the fruit preparation, sugar, and additives each contribute their own weighted share, on top of separate calculations for packaging, transport, and processing energy. The result is a single product-level number that's traceable back to exactly which ingredient, at what quantity, drove it.
.png)
That traceability is what lets the method handle a detail that spend-based accounting simply cannot see: yield. Turning milk into butter takes roughly 16 kilograms of milk to produce 1 kilogram of butter, once the fat allocation across co-products like whey is accounted for. An activity-based model captures that conversion explicitly, so a supplier switch or a recipe reformulation shows up as a real change in the footprint. A spend-based model, working from a euro figure for "dairy," has no way to represent that a kilogram of butter and a kilogram of milk are not remotely the same thing to produce.
This precision is what makes activity-based data durable under scrutiny. CSRD's ESRS E1 standard requires Scope 3 disclosures with a level of rigor comparable to financial reporting: auditable, traceable, consistent year over year. Estimation is tolerated as a starting point, but the trajectory, under CSRD and increasingly under retailer-driven scorecards and buyer requirements, points toward measured, activity-level data as the expectation, not the exception. A spend-based number, built on sector averages that can't be traced back to a specific supplier or ingredient, is a harder position to defend when an auditor starts asking where the figure came from.
There's also a compliance dimension specific to agriculture. Where a company's Forest, Land and Agriculture (FLAG) emissions exceed a material share of its total footprint, SBTi guidance requires a separate, dedicated target for that portion, which is only possible to set and track credibly with data granular enough to isolate land-use and farming-practice emissions in the first place. A sector-wide spend factor has no way to represent that distinction; it treats every euro of agricultural spend as equivalent, regardless of what's actually happening on the land it was spent on.
None of this means spend-based accounting is worthless. It remains a legitimate starting point — a fast way to get an initial footprint estimate when supplier-specific data doesn't yet exist, or to triage which categories deserve deeper investigation first. The GHG Protocol accepts it for exactly that reason. The honest case for activity-based accounting has to reckon with why spend-based is still so common: gathering physical activity data across thousands of SKUs and hundreds of suppliers is a genuinely harder data problem than pulling numbers from a procurement system.
That difficulty is real, but it's an execution problem, not a reason to accept a methodology that produces the wrong number. The path forward isn't choosing between "fast and wrong" or "accurate and unmanageable." It's building the infrastructure that makes activity-based data collection tractable rather than theoretical: food-specific emission factor libraries, supplier data collection that doesn't feel like an audit, and calculation tooling that can handle activity-based modeling at the scale of a full product portfolio.
Scale is usually the real sticking point, not willingness. A mid-sized food brand with a few hundred SKUs and a supplier base spread across multiple countries can't reasonably send an LCA consultant after every ingredient line. That's less an argument against activity-based accounting than an argument for tooling built specifically to handle it: libraries of pre-built, food-specific emission factors that cover common ingredients and production methods, so a team isn't starting from zero on every product, combined with a structured way to bring in supplier-specific data as it becomes available. The goal isn't primary data on everything by next quarter. It's a defensible, improving inventory: activity-based where it counts most, with a clear record of where estimates are still standing in and a plan to replace them.
A credible activity-based approach for a food company doesn't require perfect primary data on day one. It requires a clear hierarchy: primary data from suppliers where it's available, high-quality activity-based secondary data (ingredient- and practice-specific, not sector-wide averages) where it isn't, and a visible plan for closing the gap over time. What it should not require is defending a number to an auditor, a retailer, or your own board that you can't trace back to an actual ingredient, supplier, or process.
The companies that get ahead of this aren't waiting for activity-based data to become mandatory before they build toward it. They're treating the transition as the foundation for two things at once: a Scope 3 inventory that survives assurance, and a reduction strategy that's actually pointed at the sourcing decisions driving their footprint. Getting there starts with knowing exactly where your current numbers rely on spend-based proxies, and what replacing them with product-level, activity-based data would change.
Carbon Maps was built specifically to make activity-based accounting workable at food-industry scale — with 34,000+ food-specific emission factors and supplier engagement tooling designed to turn data collection into a collaborative process rather than an audit.







.svg)
.png)