If all emissions looked the same, one carbon accounting tool would be enough. But they don’t. Most companies know they need to measure their emissions, but overlook that how they measure them depends largely on their industry.
Carbon accounting is no longer one-size-fits-all. As reporting requirements tighten and expectations rise, specialization is becoming essential. In this article, we highlight five platforms that stand out across food, fashion, finance, industrial, and real estate sectors. We selected these platforms based on their industry specialization, emissions coverage (Scope 1–3), value chain modeling strength, and compliance support.
But before comparing platforms, it’s worth stepping back. What exactly is carbon accounting, and how does it look different from one industry to another?
Carbon accounting is the process of measuring and reporting a company’s greenhouse gas emissions (GHG) across three categories:
Carbon accounting is becoming a standard expectation for businesses. Investors, regulators, and customers increasingly want transparency around emissions, but measurement alone is not the goal. The real value lies in understanding where emissions are concentrated so companies can prioritize the right actions.
But not all industries emit carbon in the same way.
Food and fashion brands are impacted by supply chain and agricultural emissions. Financial institutions are measured by the footprint of their portfolios. Industrial companies tend to focus on operational energy use. And real estate firms must look at how buildings operate and the materials used to build them.
That’s why choosing the right tool depends on your industry.
So what does this look like in practice? Let’s explore five platforms designed to meet the needs of different sectors.
Further Reading-> Scope 3 Emissions: A Complete Guide to the 15 Categories
.jpg)
Industry challenge:
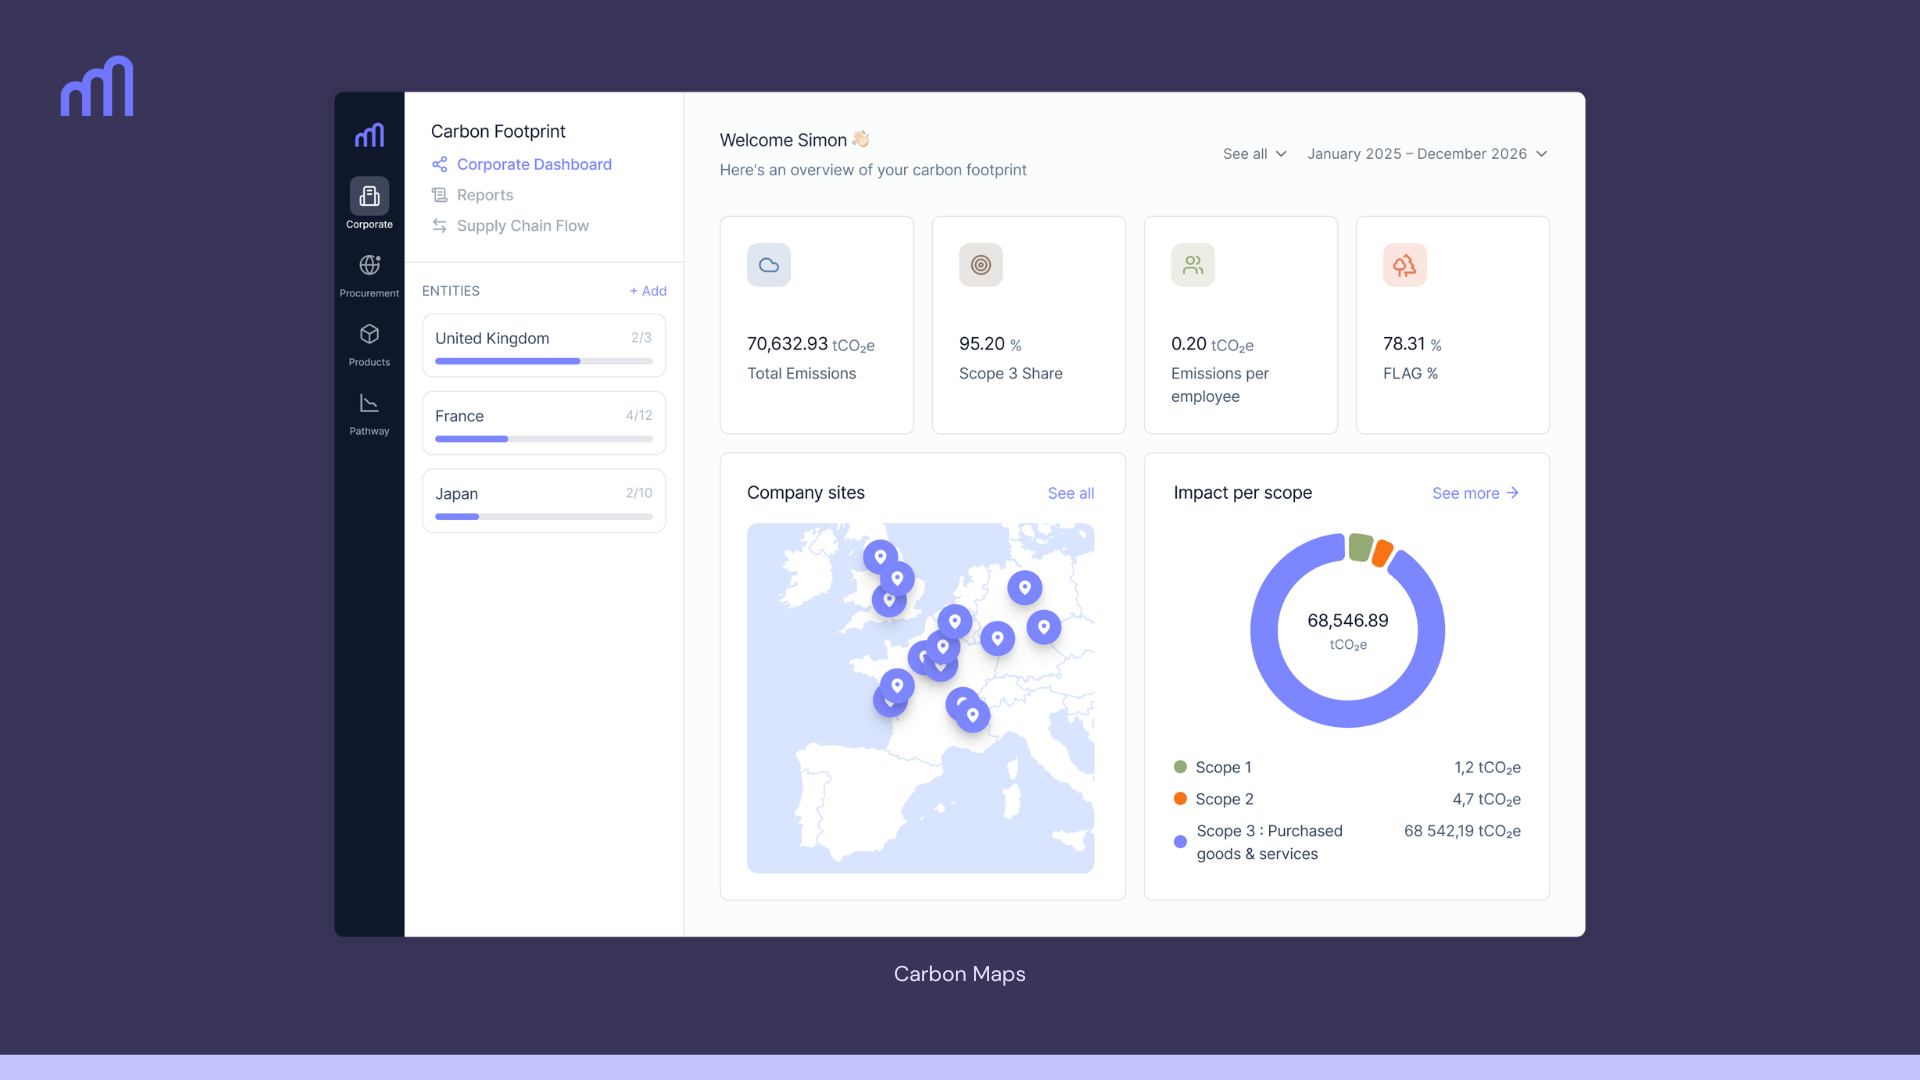
For most food companies, 80% of emissions are tied to Scope 3, particularly in agriculture, ingredients, and supplier networks. Measuring impact at this level requires a carbon accounting software designed for the realities of the food systems.
Carbon Maps is built specifically for food systems. It enables:
This makes it especially suitable for companies that need to move from high-level reporting to product-level insight and supplier engagement. In practice, this means food companies cannot measure and manage climate performance credibly with a generic, corporate-only approach. They need product- and ingredient-level modeling to understand where emissions actually come from.
Carbon Maps’s strong background and expertise in calculating PCFs (Product Carbon Footprints) and LCAs (Life Cycle Assessments) offer a strong advantage when calculating activity-based categories where generalist carbon accounting software resort to spend-based methods (particularly: 3.1, 3.3, 3.4, 3.5, 3.7, 3.9, 3.10, 3.12).
Another strong advantage of carbon accounting with deep PCF expertise is lowering the risk of compliance, incorrect assessments and greenwashing. This is because traditional carbon accounting is based on proxy black box emission factors often with very little to no relation to customer context and can therefore lead to huge mistakes.
For a food company, two ingredients with the same cost can have radically different emissions depending on farming practices, processing, transport conditions, etc. For example, one of Carbon Maps clients had a 30% error in the calculation of their Scope 3.1 emissions due to incoherent emission factors used.
Carbon Maps’ PCF-supported carbon accounting is much more reliable due to a better control in value modelisations. Concretely, any emission factor replaced at the product or ingredient level automatically updates the calculation for not just Scope 3 emissions but for the organization’s entire corporate carbon footprint.
Best for: Enterprise FMCG companies managing complex agricultural supply chains.
Industry challenge:
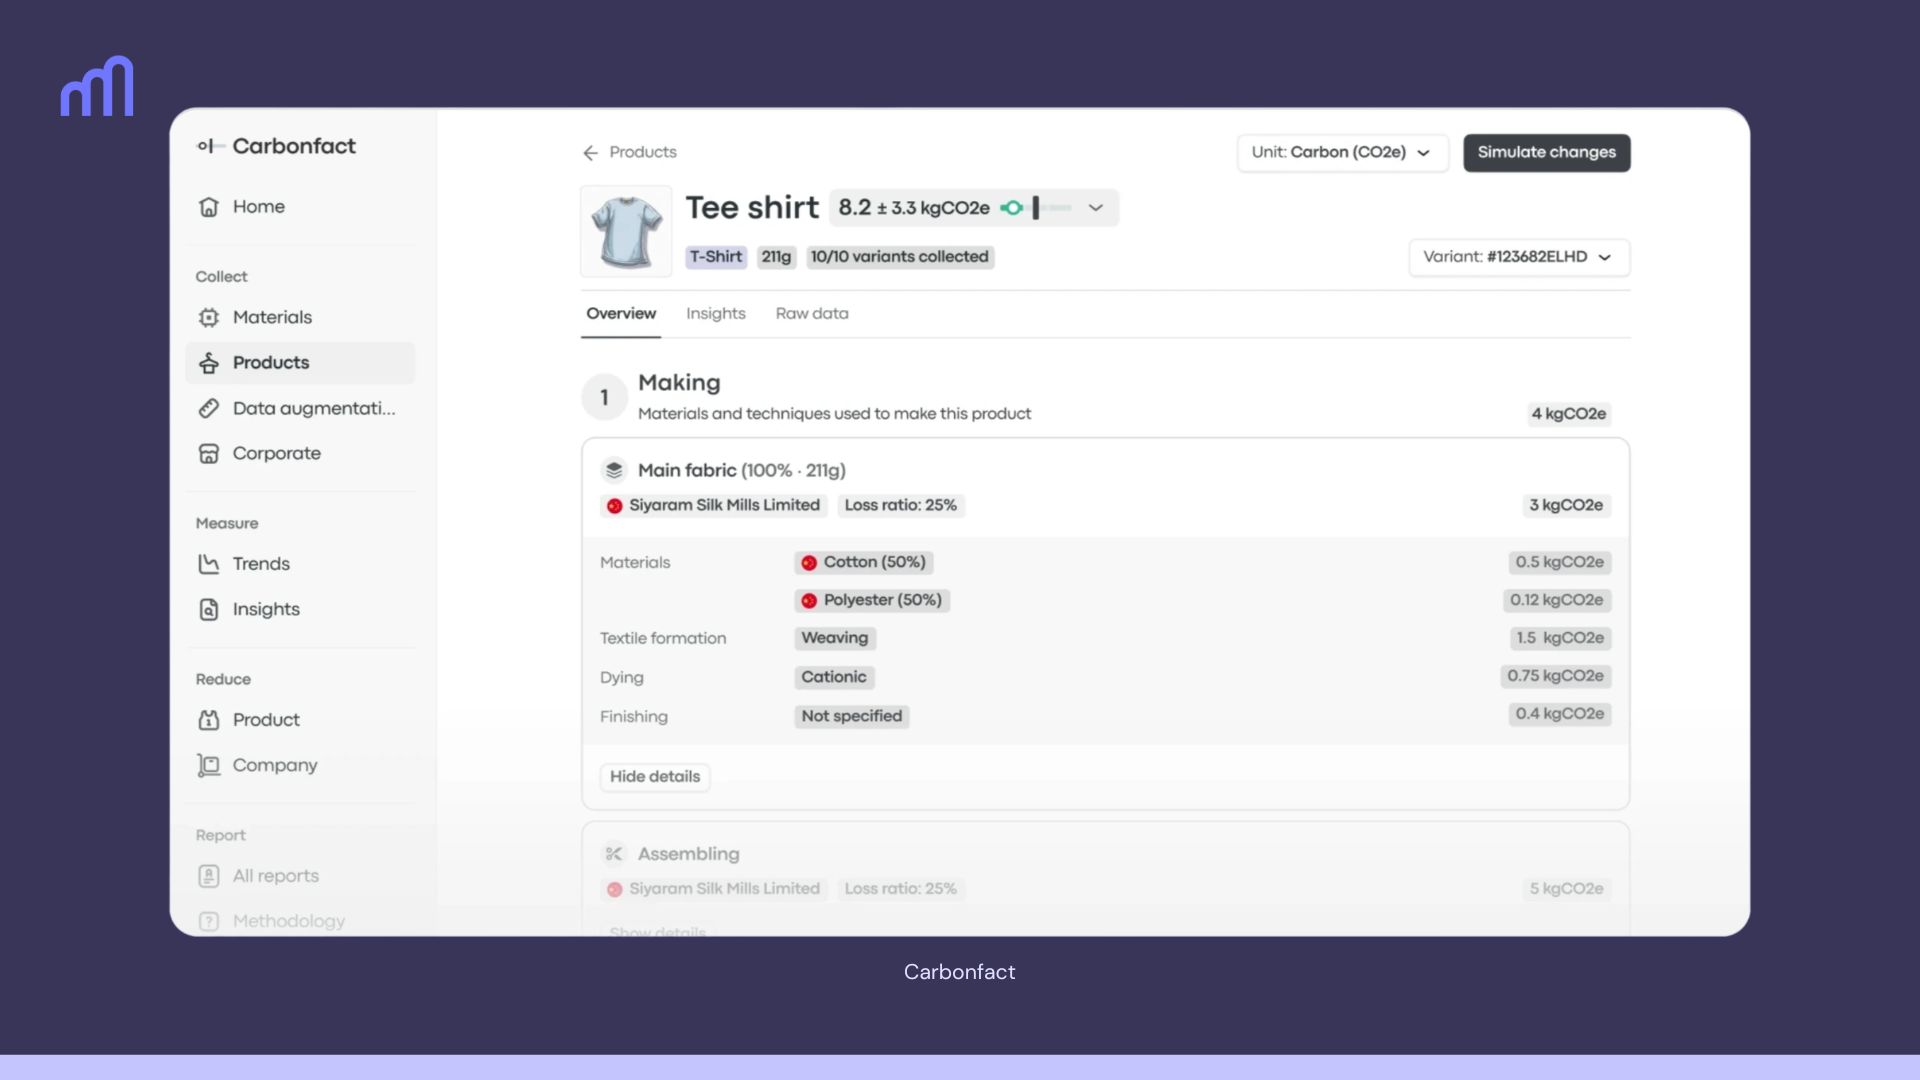
In the fashion industry, emissions are largely connected to raw materials, textiles, and manufacturing. Estimates suggest that between 80% and 96% of a brand’s footprint falls under Scope 3, covering the materials, products, and services purchased throughout the value chain.
Carbonfact is designed specifically for apparel and footwear brands, where impact is concentrated in materials and manufacturing. It offers:
This focus makes it well adapted to fashion companies aiming to reduce their emissions at a product or material level.
Best for: Apparel brands looking to measure and reduce product-level emissions.
Industry challenge:
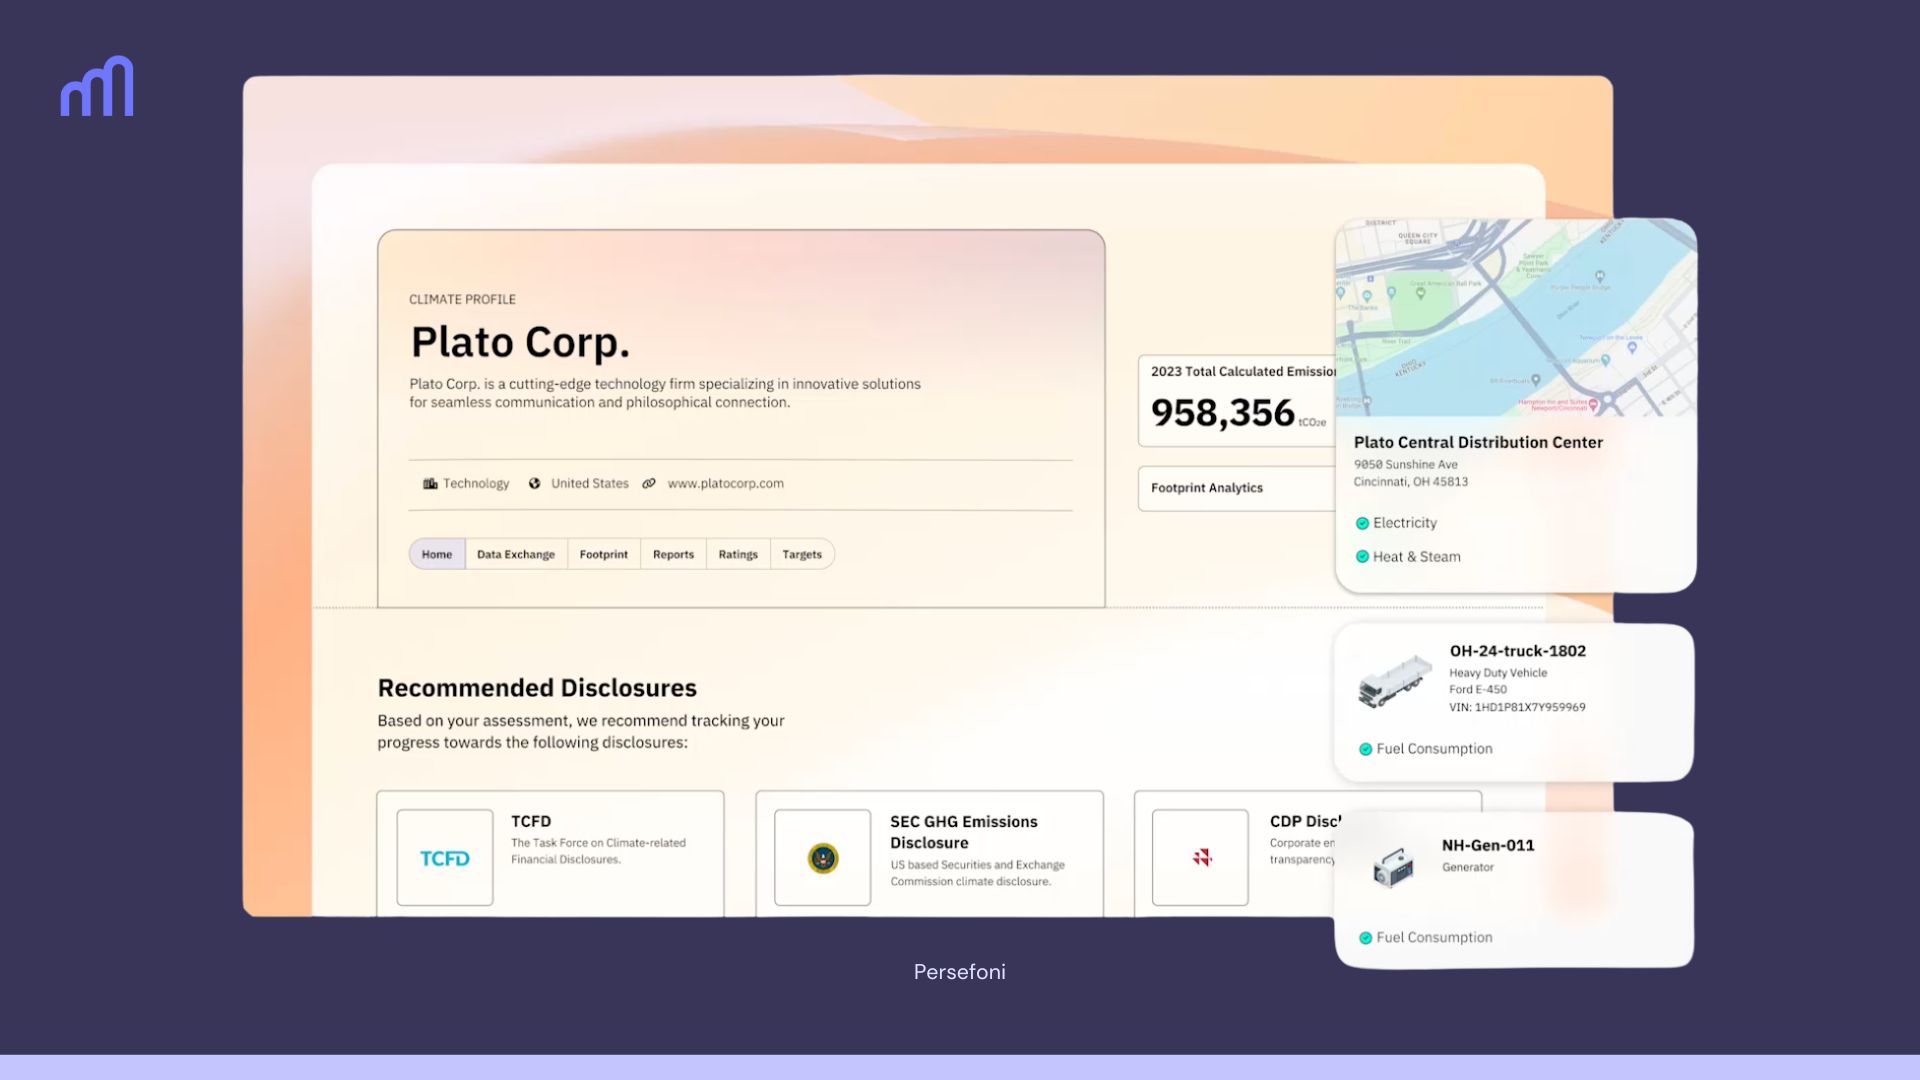
For banks and asset managers, more than 90% of emissions typically fall under Scope 3. Unlike most industries, financial institutions don’t generate most of their emissions from their own operations. These emissions come primarily from the companies they finance, invest in, or advise.
Persefoni is designed for large financial institutions that need carbon measurement across their investment and lending portfolios. It offers:
It is particularly suited for financial institutions navigating climate disclosure requirements of their financed emissions.
Best for: Financial institutions measuring financed emissions across large portfolios.
Industry challenge:
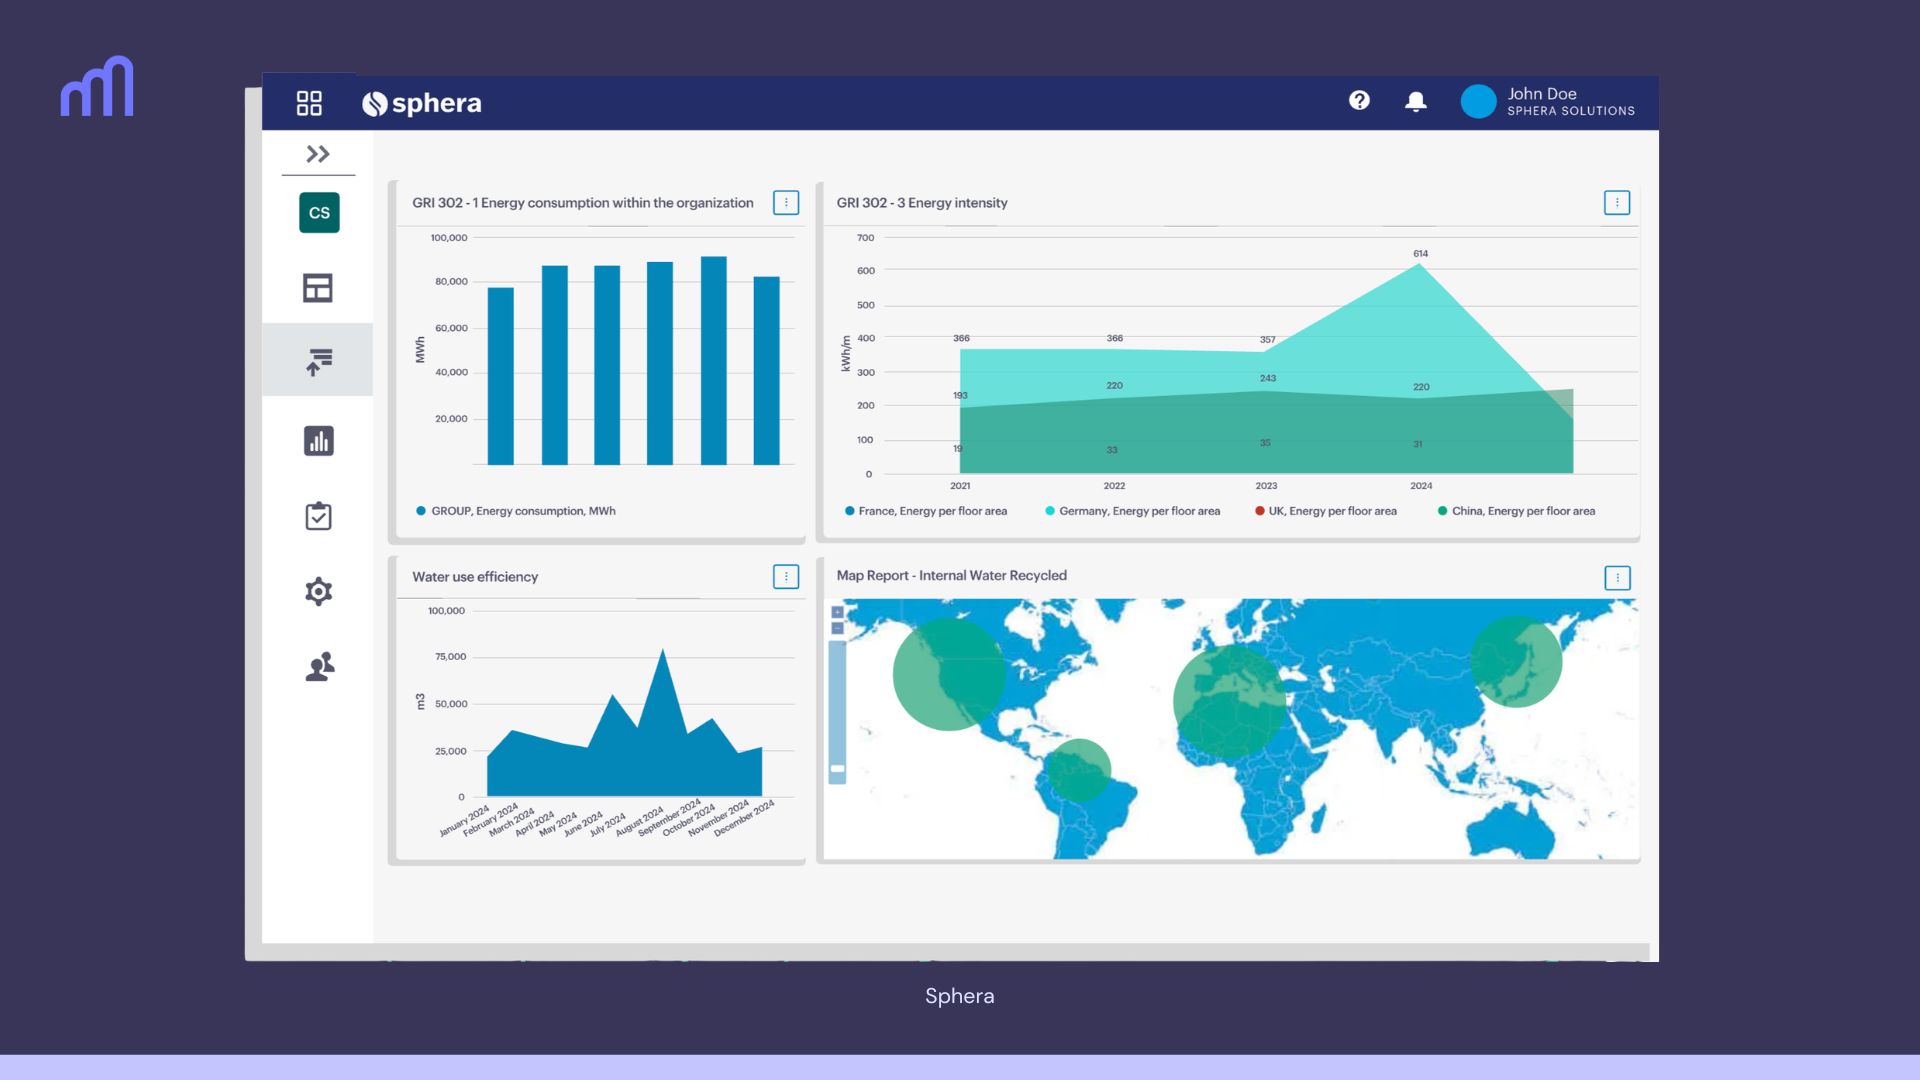
Industrial companies often face significant Scope 1 and Scope 2 emissions driven by energy use, fuel consumption, and manufacturing processes. Managing operational impact while meeting regulatory requirements can be complex.
Sphera provides tools designed for companies with large and operationally complex footprints. It offers:
Its strength lies in connecting environmental performance with risk management and regulatory compliance, making it well suited to industrial organizations operating at scale.
Best for: Large industrial companies managing operational emissions and compliance requirements.
Industry challenge:
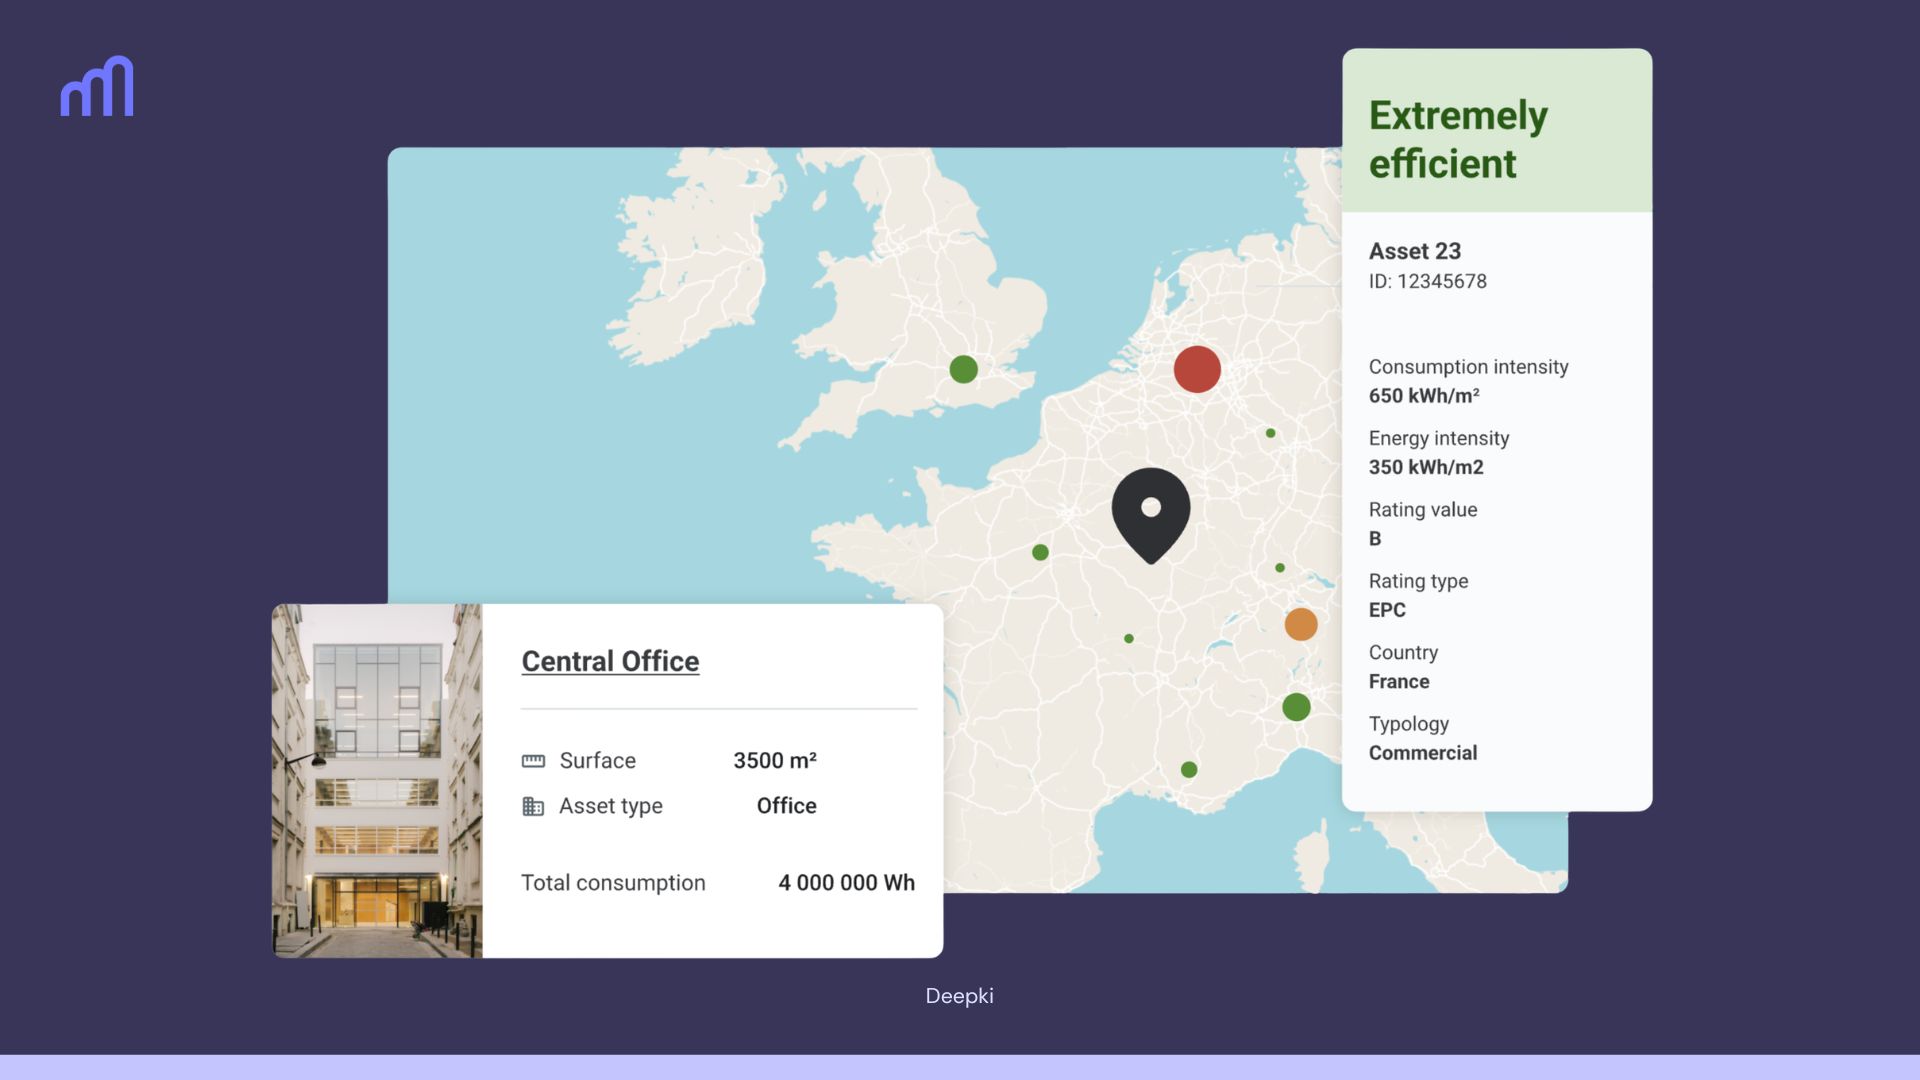
Real estate is one of the largest contributors to global emissions, accounting for roughly 38% of global CO2. About 28% comes from building operations such as heating, cooling, and electricity use (Scope 1 & 2), while another 10% is linked to construction materials and renovation (Scope 3). This means emissions stem from both operational energy use and embodied carbon across a building’s lifespan.
Deepki focuses specifically on real estate portfolios and helps property owners measure, manage, and improve building performance across assets. It offers:
This makes it particularly well suited to real estate investors and asset managers navigating building level performance and compliance obligations.
Best for: Real estate investors and property managers overseeing large portfolios.
Carbon accounting software helps companies measure, track, and report their greenhouse gas emissions across Scope 1 (direct emissions), Scope 2 (purchased energy), and Scope 3 (value chain emissions).
It enables organizations to comply with climate disclosure regulations and identify decarbonization opportunities.
Carbon accounting typically measures emissions at the company or portfolio level.
Lifecycle assessment (LCA) focuses on the environmental impact of a specific product across its entire lifecycle, from raw materials to disposal.
Some platforms integrate both approaches, depending on the industry.
For many industries including food, fashion, and finance, Scope 3 emissions make up the majority of total emissions.
These include supplier emissions, raw materials, transportation, product use, and, in finance, financed emissions.
Because Scope 3 often represents the largest share, strong value chain modeling is a key differentiator between platforms.
There is no one-size-fits-all solution.
The best software depends on:
This is why industry specialization is increasingly important.
Companies typically evaluate platforms based on:
A clear understanding of your emissions profile is the first step.
Book a demo to see how we help companies measure and manage their Corporate Carbon Footprint (CCF) with greater precision.

.png)