Background
A major French bottled water producer set out to better understand and reduce the environmental footprint of its products. With growing scrutiny on packaging and logistics, the company partnered with Carbon Maps to perform detailed Product Carbon Footprints (PCFs) across its portfolio. The goal was to replace generic assumptions with product-specific insights, enabling more precise eco-scores, accurate Scope 3 measurement, and actionable reduction levers.
The objective
The project sought to:
- Perform granular Product Carbon Footprints (PCFs):
Calculate environmental footprints for a range of bottled water products, customized to reflect actual production conditions.
- Gain visibility on Scope 3 emissions:
Especially those linked to packaging and logistics, which make up the majority of the product impact.
- Translate findings into action:
Identify reduction levers, simulate improvements, and prioritize decarbonization initiatives.
- Enable cross-functional collaboration:
Provide access to a centralized platform for calculations, recommendations, and visualization of results.
Carbon Maps' approach
Project Scope and Data Personalization
Carbon Maps conducted a detailed study covering 11 representative products across 2 production sites, chosen as high-volume references within a portfolio totaling 249 million units sold annually. Data collection extended to 60 logistics partners, 22 suppliers, 67 materials, and 4 destinations.
The analysis combined industry databases where primary data was lacking with the client’s real-world data—including packaging composition, energy consumption, transport modes, and kilometers traveled—to ensure as much granularity as possible.
Where data came in aggregated forms (e.g., per production line rather than per machine), Carbon Maps adapted the modeling to best reflect operational realities. Packaging end-of-life impacts were also modeled to incorporate the client’s own recyclability data, going beyond generic inventory values. For example, the previous generic assessment assumed all materials were virgin; the customized approach correctly accounted for recycled content (e.g., 30% recycled content).
Custom Product Carbon Footprint Modeling
Key methodological choices included:
- Packaging transformation: Energy used for preparing bottles and heating preforms was modeled in the transformation step.
- Packaging end-of-life: Integrated the client’s real data to improve accuracy versus standard databases.
- Transport allocation: Followed established methodological rules to ensure fair attribution, particularly for heavy formats like glass bottles.
Key Results
The PCF provided the client with precise, actionable, and quantifiable insights into their bottled water portfolio, confirming intuitions while translating them into clear levers for action. Three key benefits emerged:
1. Granular and Personalized Impact Understanding
The project delivered a product-level view grounded in the real activity of both production sites. By tailoring the PCF methodology with actual data—composition, energy, transport, and end-of-life—the team gained a validated understanding of impact hotspots.
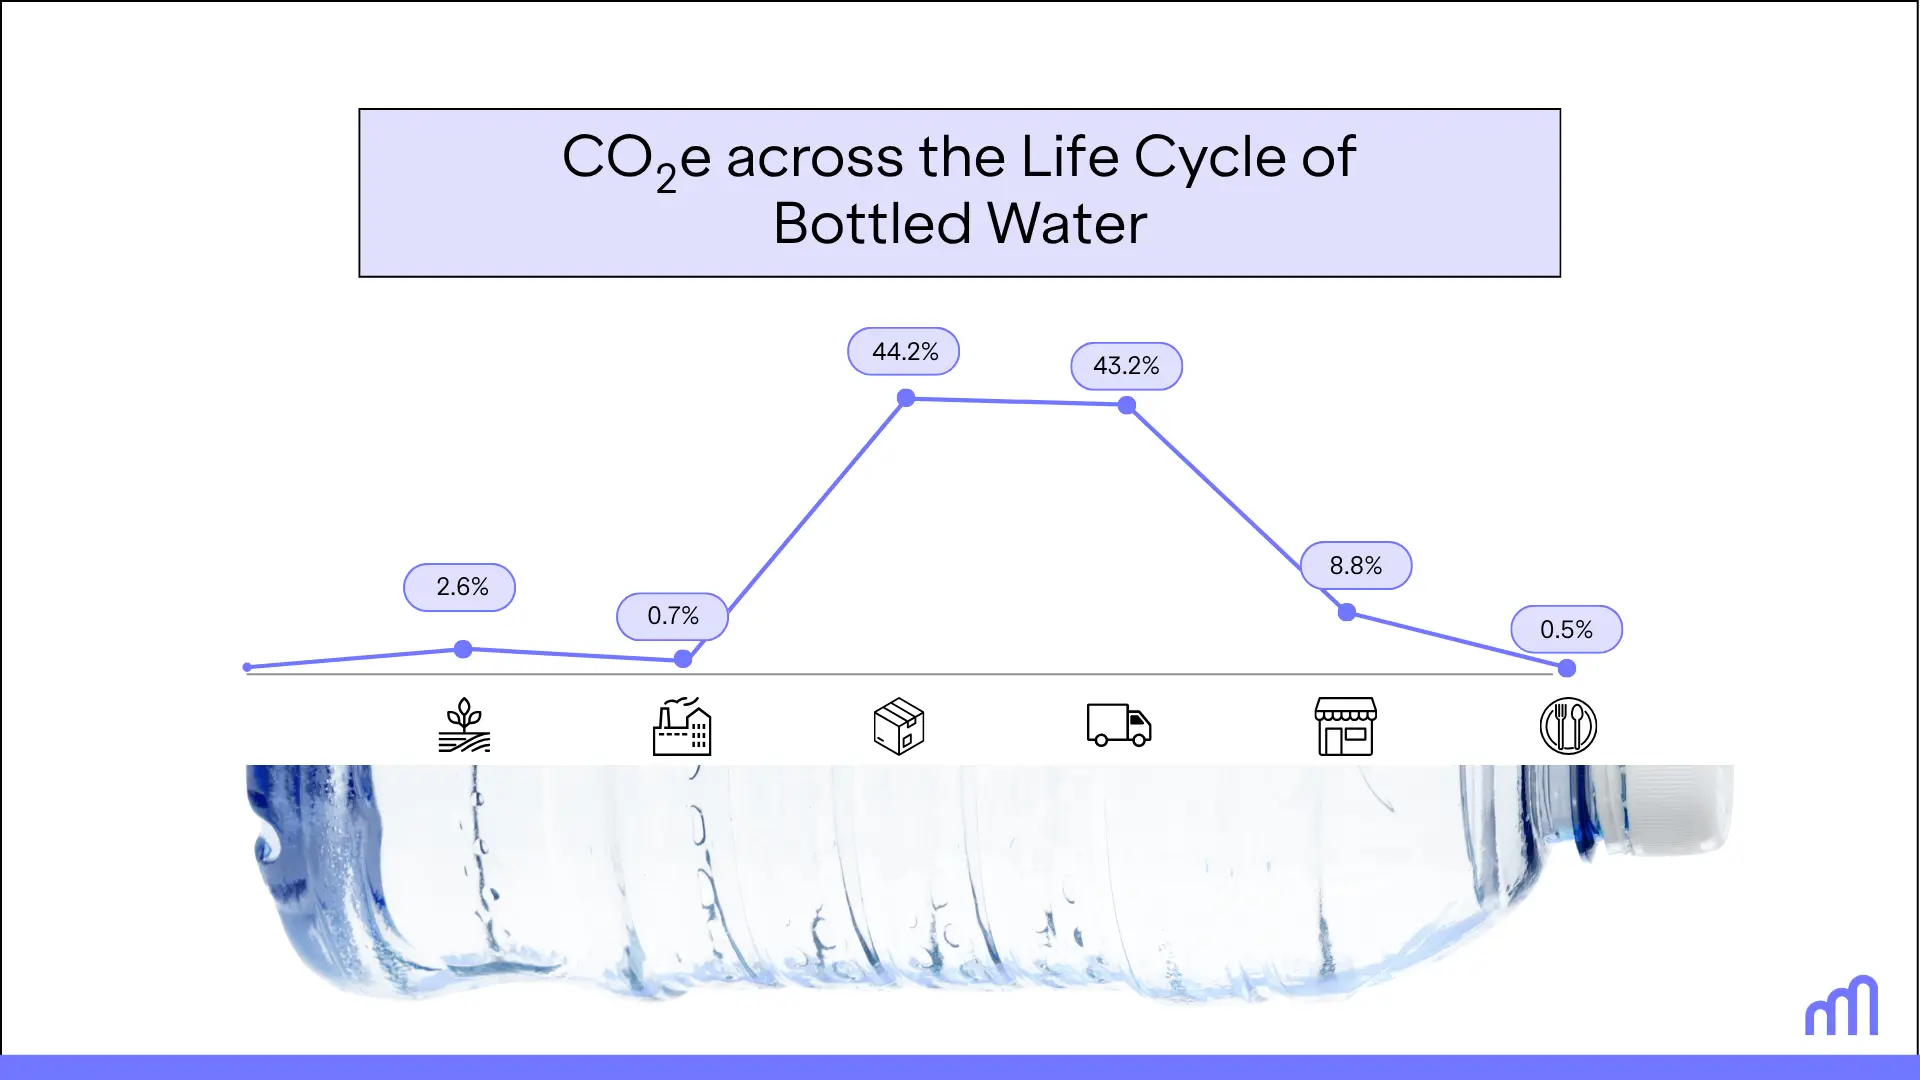
While packaging transformation was expected to weigh heavily, the analysis revealed that packaging (44.3% of total impact) and transport (43.4%) are the true drivers, with PET preforms alone accounting for 74% of packaging impact. This shift in focus provided clarity on where to concentrate efforts.
This collaboration showed that detailed PCFs can transform assumptions into actionable insights. By pinpointing packaging and transport as the main levers, the company now has a roadmap to reduce emissions, future-proof its eco-labeling, and deliver measurable progress toward sustainability goals.
2. Actionable Strategic Recommendations
Carbon Maps identified concrete eco-design levers, each supported by quantified reduction scenarios:
- Materials: Increasing recycled PET content in preforms could reduce emissions by up to 7%.
- Product Assortment: Prioritizing larger bottle formats could save 4%.
- Transport & Logistics: Full truckloads, lightweight pallets, and alternative fleets provide immediate opportunities to reduce Scope 3 emissions.
Across 249 million bottles sold annually, a potential ~11% reduction translates into thousands of tonnes of CO₂e avoided—turning incremental changes into significant footprint reductions at scale.
3. Tools for Eco-Design and Simulation
Beyond one-off results, the project gave the client access to Carbon Maps’ platform, a centralized tool that makes results visible, collaborative, and easy to use. Crucially, it also enables simulation of future scenarios—such as testing recycled content thresholds or rebalancing product assortments—supporting both strategic planning and day-to-day decision-making.
What this enables next
Scaling with confidence:
Standardized, audit-ready PCFs that extend across the portfolio and stay current as suppliers, formats, and lanes evolve—supporting credible eco-scores and upcoming labeling rules.
Turning insights into specs:
Quantified levers (rPET thresholds, format mix, logistics efficiency) translate into procurement-ready requirements and day-to-day decisions.
Prioritizing impact fast:
Scenario simulations highlight the biggest CO₂e wins and payback, guiding investment, supplier engagement, and rollout sequencing.
Ready to act on your product footprints?
Explore your reduction levers—materials, formats, and logistics—and start cutting emissions where it counts.
{{"block": "cta-card", "title": "Turn your product LCAs into procurement-ready specs.", "link": "https://www.carbonmaps.io/demo-request", "image": "https://cdn.prod.website-files.com/65314a18c462865b9b841f1d/6981fb8e1f9629c3a77135b2_Illo_01.svg"}}