products

Product-level carbon footprints and LCAs at scale.

Audit-ready product-level assessments across carbon, water, land use, and biodiversity, built from the data you already have.
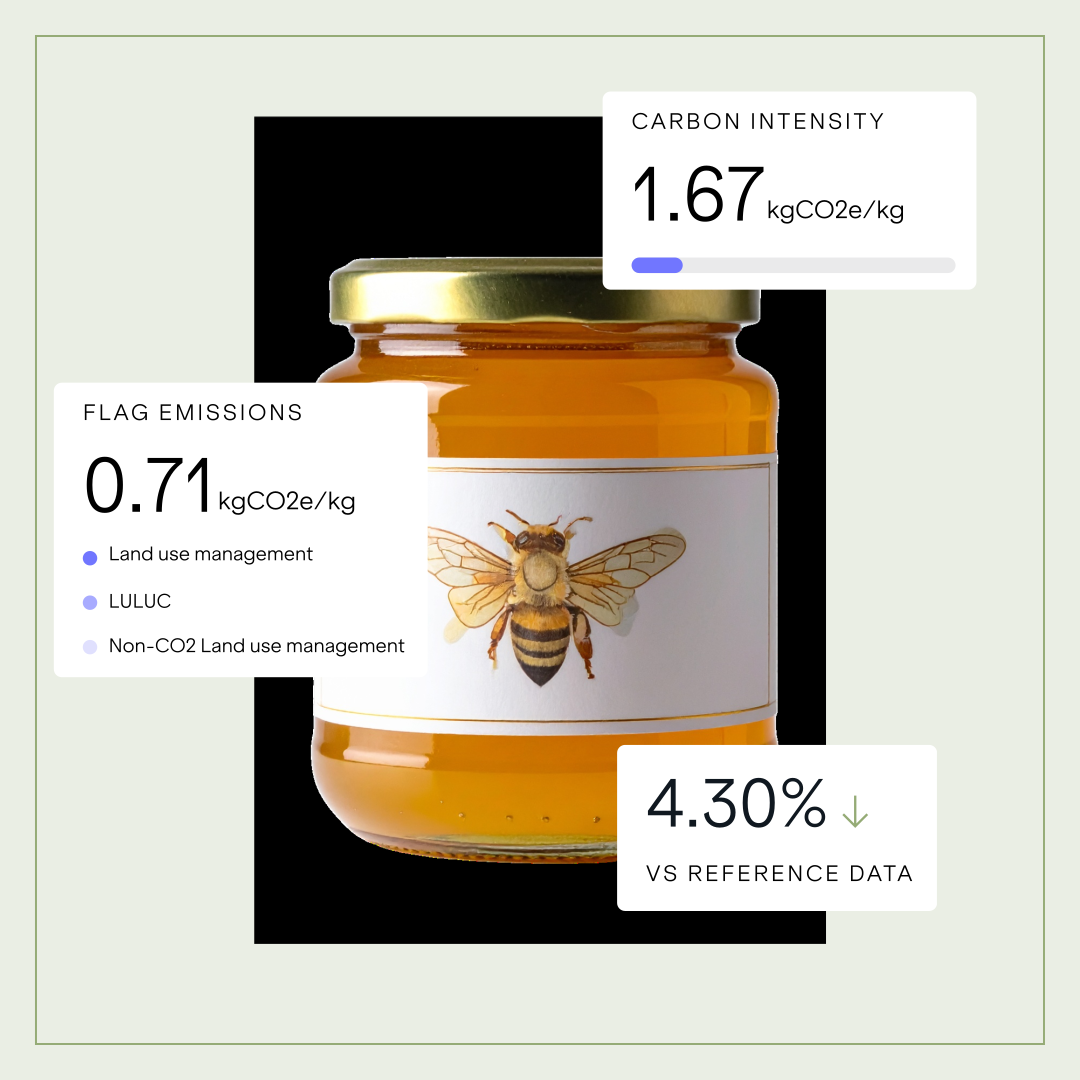
Carbon Maps product carbon footprint analysis of a food product showing carbon intensity, FLAG emissions, and benchmark comparison.
the challenge

Up to 90% of your product's footprint
is agricultural. Almost none of it is in your ERP.

The bulk of the food industry's emissions aren't hiding in factories. They're distributed across thousands of farms, suppliers, and ingredients. Most of them upstream, outside your operational boundary, and invisible in your purchasing data.
Measuring at the product level means modeling that complexity at scale, with methodology auditors accept and business leaders can act on.
~90%
of a food product's footprint comes from agriculture
15 categories
of Scope 3 emissions to track and report
$25 K
typical starting cost for a single cradle-to-gate LCA
6 weeks
average length of time it takes for a single product-level LCA
Why Carbon Maps

Built for the
hardest part of product-level assessments.

Generalist platforms see one ingredient where we see a supply chain, demand perfect data where we model what's missing, and stop at carbon where we go further.
01 - Built for complex supply chains
A minimalist, ultra-thin line art icon an un-filled stroke to represent agriculture.
Agricultural
expertise built in.
Supply chains rooted in agriculture are among the most complex to model: long, opaque, and highly variable. Carbon Maps is purpose-built for this reality, with emission factors, methodologies, and data models that reflect the true complexity of food and agriculture supply chains.
02 - Value on day one
A minimalist, ultra-thin line art icon an un-filled stroke to represent speed and value from day one.
Granular assessments from day one.
Most tools require months of data collection before they can produce anything credible. Carbon Maps generates granular product-level assessments from your minimum viable data, then improves automatically as supplier data flows in, so decisions don't wait for perfect data.
03 - Multi-indicator
A minimalist, ultra-thin line art icon in green an un-filled stroke to represent multi-indicators.
Beyond carbon, across every environmental KPI.
Carbon is only part of the picture. Carbon Maps calculates full life cycle assessments, covering water use, land use, biodiversity impact, and more, so your environmental reporting goes deeper without adding complexity for your team.
The platform

Four principles built into every product-level assessment by Carbon Maps.

01 · Compliant
Meet the standards
your stakeholders
already require.
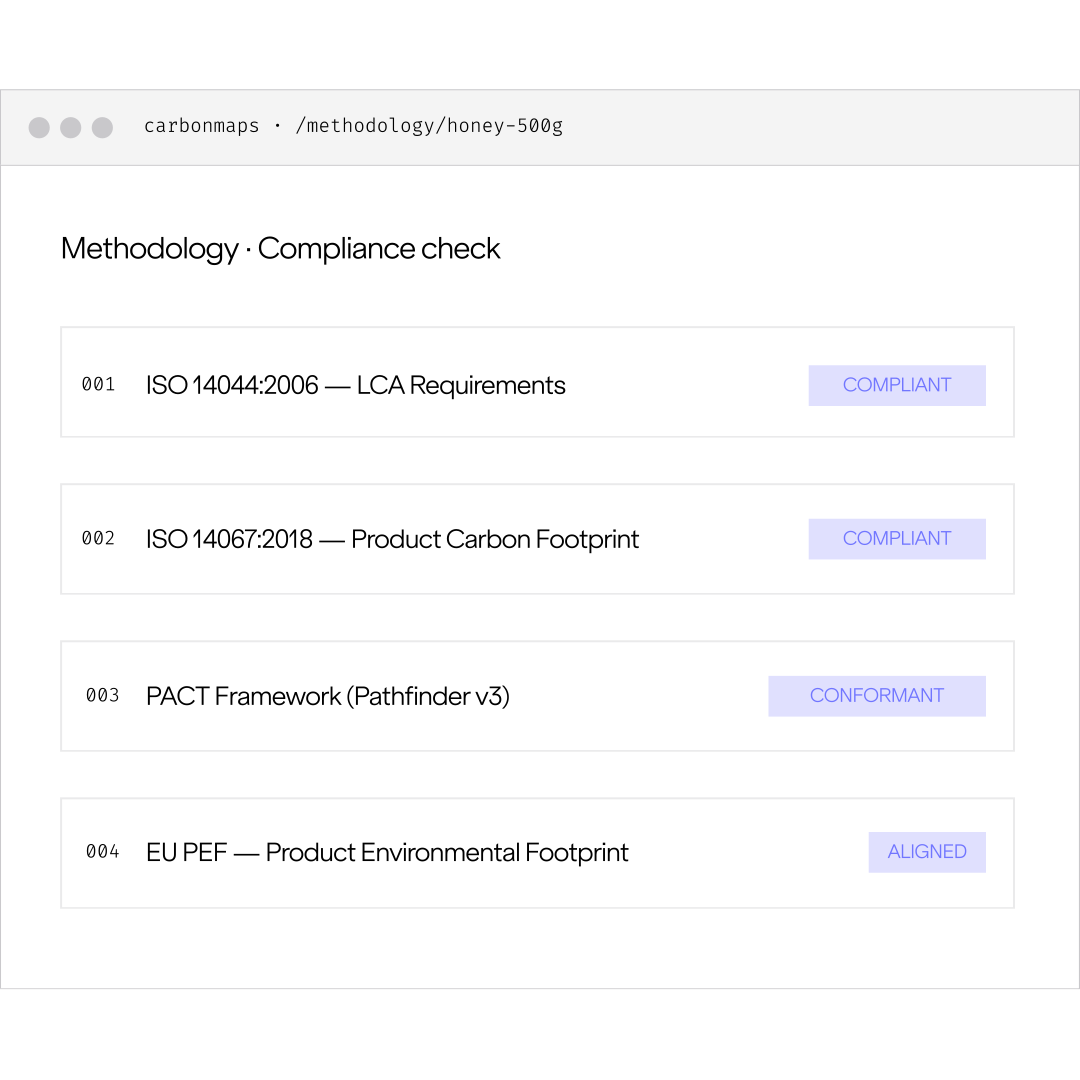
Carbon Maps assessments are aligned with ISO 14040 and 14044, PACT, and PEF methodologies—the frameworks your customers, retailers, and suppliers already use. Every calculation is audit-ready and comparable, so your disclosures hold up to scrutiny wherever they land.
A minimalist, ultra-thin line art icon to represent a check mark.
ISO 14040 / 14044
A minimalist, ultra-thin line art icon to represent a check mark.
PACT V3 (Pathfinder) conformant
A minimalist, ultra-thin line art icon to represent a check mark.
EU PEF methodology
A minimalist, ultra-thin line art icon to represent a check mark.
Third-party auditable trails
Carbon Maps methodology compliance check interface verifying alignment with ISO 14044, ISO 14067, PACT, and EU PEF standards.
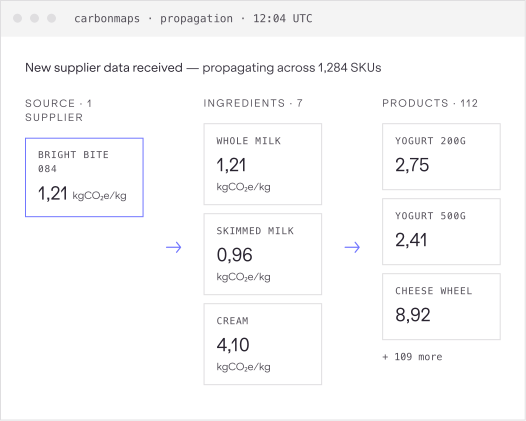
Carbon Maps platform interface showing automated supplier emission data propagation across ingredients and product SKUs.
02 · coherent
Every update,
reflected across
your entire portfolio.
When new supplier or customer data becomes available, Carbon Maps propagates that improvement across every affected product and supply chain. No manual reconciliation, no version-control headaches, just a methodology that stays consistent as your data matures.
A minimalist, ultra-thin line art icon to represent a check mark.
Automatic propagation of new data
A minimalist, ultra-thin line art icon to represent a check mark.
Versioned calculation history
A minimalist, ultra-thin line art icon to represent a check mark.
Portfolio-wide recalculation in minutes
03 · Complete
Life Cycle Assessments at scale, whatever your starting point.
Most tools stall when data is incomplete. Carbon Maps delivers granular life cycle assessments whether your supply chain data is complete, partial, or missing, so you can start measuring today and refine as your visibility grows.
A minimalist, ultra-thin line art icon to represent a check mark.
2 000 000+ product and packaging LCAs calculated
A minimalist, ultra-thin line art icon to represent a check mark.
34 000+ emission factors
A minimalist, ultra-thin line art icon to represent a check mark.
Intelligent data gap-filling
Learn the importance of calculating Product Carbon Footprints →
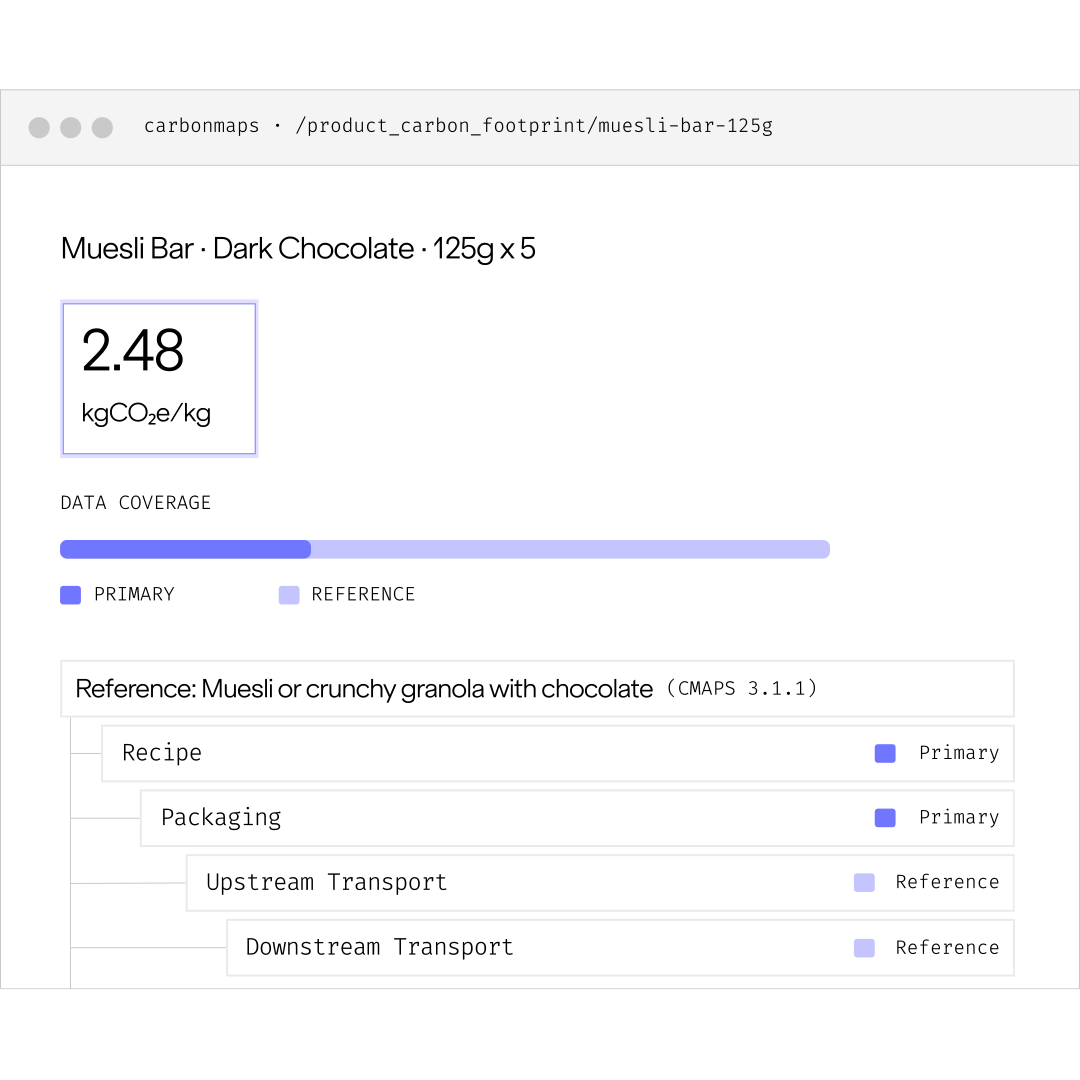
Carbon Maps product carbon footprint interface displaying emission calculations and primary vs. reference data coverage for a food item.
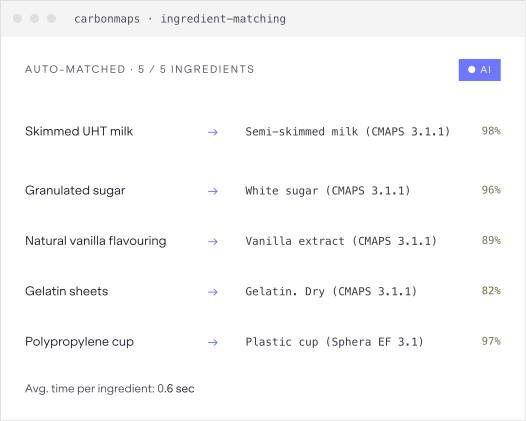
Carbon Maps AI interface automatically matching food product ingredients to emission factor database items.
04 · AI-driven
From ingredients to
emission factors,
automatically.
Generic tools assign a single emission factor to a finished product and call it done. Carbon Maps decomposes every product into its ingredients, packaging, and processing steps, and matches an emission factor to each one. AI makes it possible across thousands of products at once.
A minimalist, ultra-thin line art icon to represent a check mark.
Component-level matching: ingredients, packaging, processing, transport
A minimalist, ultra-thin line art icon to represent a check mark.
Confidence scoring on every match
A minimalist, ultra-thin line art icon to represent a check mark.
Human-in-the-loop review queue
What our customers say

Chosen by companies that don't compromise on methodology.

"
Beyond the platform itself, their team helped structure our data and provided a rigorous, actionable methodology while adapting to the specificities of our products.
Close-up portrait of a male customer
Florian Trohay
Deputy Director of Sustainability · Sodiaal
"
Carbon Maps’ platform allows us to make carbon data a key element in our exchanges with upstream suppliers and downstream customers, enabling us to make decisions that take this important issue into account.
Portrait of a female customer
Amélie Riou
Sustainability Manager · Transgourmet France
Trust & compliance

Aligned with the standards that matter.

Logo of PACT (Partnership for Carbon Transparency)
PACT
Pathfinder Framework V3, the cross-industry standard for exchanging product carbon data.
Logo of Bureau Veritas
ISO 14040/44/67
Declared compliant with international standards for life cycle assessment principles and requirements.
Logo of TÜV Rheinland that signifies Carbon Maps' platform's certification.
TÜV Rheinland
Independent third-party validation confirming Carbon Maps' PCF calculation methodology meets the requirements of PACT V3 and the TfS PCF Guideline.
Logo of PEF (Product Environmental Footprint)
EU PEF
Developed by the European Commission. Uses cradle-to-grave LCA covering 16 impact categories including climate.
FAQ

Everything you need to know about product-level footprints.

Still have questions?
Our team can walk you through the methodology, data ingestion, and deployment plan in a dedicated call.
What is LCA in the food industry?
+
A Life Cycle Assessment (LCA) measures the full environmental impact of afood product from cradle to grave — including farming practices, production,packaging, transport, consumption, and end-of-life. It covers multipleindicators such as carbon emissions, water use, and land use. A ProductCarbon Footprint (PCF) is a specific outcome of an LCA, focusing only ongreenhouse gas emissions (CO₂e). It's particularly useful for climate reporting,supply chain engagement, and setting science-based targets. In short: everyPCF is based on LCA methodology.
How can food companies scale LCAs and PCFs across large product portfolios?
+
With traditional methods, running LCAs or PCFs across hundreds of SKUs is time-consuming. Software like Carbon Maps automates the process, allowing brands, manufacturers, retailers, and foodservice players to calculate carbon footprints and other environmental impacts consistently across thousands of products. This ensures both LCAs and PCFs are reliable, comparable, and fast to produce.
What makes Carbon Maps different from other LCA or PCF tools?
+
Carbon Maps combines product- and ingredient-level granularity at scale. Our platform generates both comprehensive LCAs (multi-impact) and granular PCFs (carbon-only) across entire product portfolios. All outputs align with international standards such as ISO 14040, 14044, and 14067 as well as the EU Product Environmental Footprint (PEF).
Can I use Carbon Maps without complete supplier data?
+
Yes. By leveraging a growing database of over 34,000 emission factors and Carbon Maps' ability to automatically model complex supply chains, our platform can fill in data gaps, match similar emissions categories and life cycle stages, and generate auditable assessments at the product level, making it possible to assess environmental impact at scale in a cost-effective way.

Learn more about how Carbon Maps carries out Product-level Assessments at Scale

Blog Image

The French Eco-Score for Food: What It Is, How It's Calculated, and How Carbon Maps Is Making It a Reality at Scale

Read
arrow forward
Blog Image

How Carbon Maps' PCF Calculation Methodology for the Food Industry Was Built to Be Trusted

Read
arrow forward
Blog Image

How to Use a Product Carbon Footprint in the Food Industry: A Complete Guide 2026

Read
arrow forward