
You keep hearing that you need a Product Carbon Footprint. A retailer has asked for one. You've seen it mentioned in a sustainability report. Maybe your biggest customer sent over a questionnaire and one of the questions was about the carbon footprint of your products, and you didn't know what to write.
Most food companies are in exactly the same position: they know this is coming, they're just not sure where to start.
This guide will walk you through everything from scratch, what a Product Carbon Footprint actually is, why the food industry specifically is under the spotlight, what data you'll need, and how to calculate one. No technical background required.
A Product Carbon Footprint (usually shortened to PCF) is a number that tells you how much greenhouse gas (GHG) is produced when making, shipping, and selling one unit of your product.
That number is expressed in "kg CO2e" which means kilograms of CO2 equivalent. The "equivalent" part means it covers all greenhouse gases, including carbon dioxide (CO2), methane (CH4), nitrous oxide (N2O), and various fluorinated greenhouse gases (F-gases) converted into a single comparable unit. So whether the emissions came from a cow's digestion, a factory's energy use, or a delivery truck, it all gets added up into one number.
Take two standard 140g yogurts sitting side by side on a supermarket shelf. They look identical, same product, same portion size, same price. But one has a carbon footprint of 1.3 kg CO₂e/kg, while the other comes in at 2.2 kg CO₂e/kg. That's almost 70% higher.
The difference has nothing to do with the yogurt itself. It comes down to the choices made further up the supply chain. The type of milk used, how the cows were fed, where the energy came from, and what the packaging was made of. The lower-carbon yogurt was made with locally collected fresh milk from grass-fed cows, produced using green electricity, and packaged in recycled PET. The higher-carbon one used imported powdered milk from grain-fed cows, high-carbon electricity, and standard PET packaging.
This is exactly why a Product Carbon Footprint is so valuable. Without one, both yogurts look the same. With one, you can see precisely where the emissions are coming from, and what to change.
Dairy is one of the most complex ingredients to calculate emissions for. Factors like milk yield, feed type, farming method, and country of origin all play a role. We go into much more detail in our in-depth guide to the carbon footprint of dairy. Read the full article here.
.jpg)
You might also hear the term LCA (Life Cycle Assessment). A PCF is similar, but narrower, it only looks at greenhouse gas emissions. An LCA covers a broader set of environmental impacts like water use and land use. For most food companies starting out, a PCF is the right place to begin.
To learn more about LCA read our in-depth article →
If you work in food manufacturing, ingredient supply, or food retail, you're probably already feeling this. Here's why the pressure is real and why it's only going to increase.
Major supermarkets and food brands including Tesco, Nestlé, and Danone, have all committed to reducing emissions across their supply chains. To do that, they need verified emissions data from the suppliers they buy from. If you're a supplier, this pressure is already making its way down the chain. Companies that can provide accurate PCF data will keep and win contracts. Those that can't risk being deprioritised or delisted.
The EU Green Claims Directive, expected to take effect from 2026, means that any environmental claim made on a food product ("low carbon", "climate-friendly", "sustainable") must be backed by verified data. If you can't prove it, you can't say it. Fines and reputational damage await companies that get this wrong.
The EU's Corporate Sustainability Reporting Directive (CSRD) also requires medium and large companies to report on the environmental impact of their products. For food companies selling in European markets, this is no longer optional.
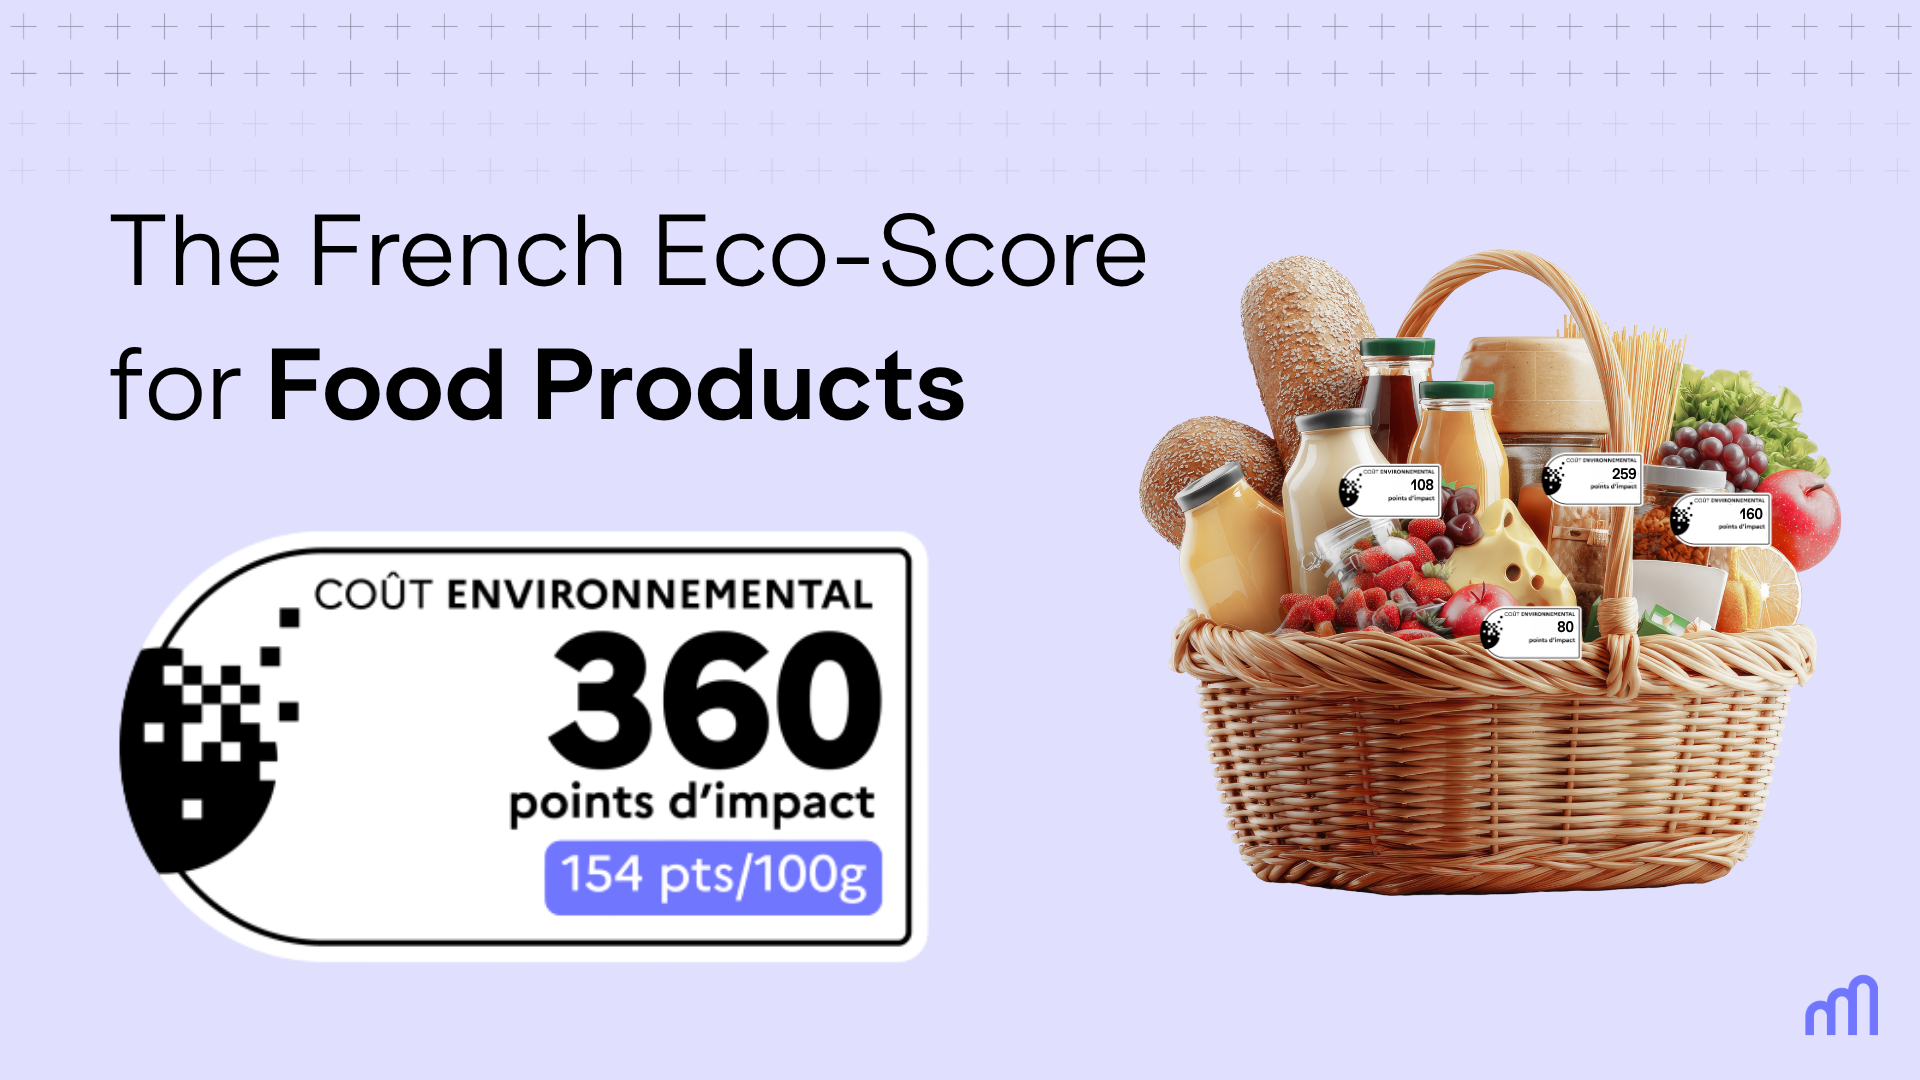
You may have noticed labels like Eco-Score or Planet-Score appearing on food products in European supermarkets. These scores are partly based on product carbon footprints. If your competitors are displaying a low-carbon label and you're not, shoppers, especially younger ones, notice.
Here's an honest answer: it depends on your situation. Here's a simple way to think about it.
You probably need a PCF now if any of the following are true:
You might be able to wait a little longer if:
Here's what happens if you delay. Your customer starts requiring PCF data from all suppliers. You scramble to produce a number quickly without the right data or the right tool and the number you come up with is inaccurate or unverifiable. That's worse than having no number at all, because it exposes you to greenwashing risk.
It's much better to start the process properly now, even with imperfect data, than to rush it later.
A PCF looks at every stage of your product's life, from the moment raw ingredients are grown or raised, all the way to what happens after the consumer throws the packaging away. This is called the product's lifecycle.
Here's what each stage typically contributes, using a simple packaged food product as an example:
.jpg)
The most important thing to understand: in food, the agriculture stage is almost always where most of the emissions come from. This means switching to LED lighting in your factory or using recycled cardboard for your boxes, while worthwhile, won't move the needle much. The real opportunity, and the real data challenge, is in your ingredients.
You'll come across these two terms when setting up your PCF. They refer to how far along the lifecycle you measure:
.jpg)
The right boundary depends on two things: who your end customer is, and what you're trying to achieve with your PCF. If you're a manufacturer selling ingredients or components to other food businesses, like a company supplying fruit purées, flavourings, or whey powder to brands who then use them in their own recipes, cradle-to-gate is the natural stopping point. Your emissions responsibility ends when the product leaves your factory. On the other end of the spectrum, a company like Foodles, which sells meals directly to the people who eat them, needs to score the full lifecycle because the carbon impact needs to be communicated all the way to the consumer. But it's not always that black and white. Some retailers and brands opt for cradle-to-gate even when they're not ingredient makers: Żabka, for example, started with cradle-to-gate specifically because their goal was to onboard and benchmark their suppliers, focusing entirely on upstream emissions to identify where in their supply chain the biggest gaps were.
When in doubt, start with cradle-to-gate. It's more manageable, and you can always expand the boundary later.
Not sure which boundary applies to your business? Download our free guide and take the quiz to find out in 3 questions.
We touched on this above, but it's worth going deeper because it changes how you approach a PCF entirely.
In most food products, the top 2–3 ingredients account for the majority of the carbon footprint. Here are some of the biggest emission drivers in food:
On the other hand, some ingredients have a very low footprint: legumes like lentils and beans, most fruits and vegetables grown without intensive inputs, and sustainably sourced cereals.
If you make a product that contains beef, dairy, or palm oil, your PCF is almost certainly dominated by those ingredients. The most impactful things you can do are:
Here's the process broken down into simple steps. Don't worry about getting every detail perfect on the first attempt. Most companies start with rough estimates and refine over time.
Step 1: Pick Your Product
You don't need to calculate a PCF for every product you make immediately. Start with one, ideally your highest-volume product, or the one a customer is actively asking about. Once you've done one, the rest get easier.
Step 2: Decide Your System Boundary
As covered above: are you going cradle-to-gate (up to your factory) or cradle-to-grave (including consumer and disposal)? For most B2B food companies starting out, cradle-to-gate is the right call.
Step 3: List Every Ingredient and Its Weight
Get your recipe or bill of materials. You need the weight of every ingredient that goes into one unit of your product and ideally, where each ingredient comes from (country or region of origin). A tomato grown in Spain has a different footprint to a tomato grown in a heated greenhouse in the Netherlands.
Step 4: Add Your Packaging
List the packaging materials and their weights, the plastic film, cardboard box, glass jar, whatever it is. These have their own emissions from the manufacturing process.
Step 5: Gather Your Facility Energy Data
How much electricity and gas does your factory or processing site use? Your energy bills are the main source for this. You'll need to attribute a portion of that energy to each product. A tool will usually handle this calculation for you.
Step 6: Apply Emission Factors
This is where a lot of companies get stuck doing it manually. An emission factor is essentially a number that says "this ingredient or process produces this much CO2e per kg." There are large databases of these factors, including food-specific ones like Agribalyse and Ecoinvent, but navigating them manually is time-consuming and technical.
This is the step where the right software tool makes an enormous difference. A good food-focused PCF tool will have these databases built in and do the application automatically.
Step 7: Sum It Up and Find Your Hotspots
Once you have each ingredient and process converted into CO2e, you add it all up to get your PCF number. You'll also be able to see which ingredients or steps are responsible for the most emissions. These are your "hotspots", and they're where you should focus your reduction efforts.
Here's a practical checklist. Don't panic if you don't have everything, Carbon Maps is one of the only PCF platforms built to work with whatever level of data you have. With Carbon Maps all you need is the name of your product to get started. We will automatically match it to the closest product in our database using our own proprietary emission factors and external databases, and generate a PCF straight away. No ingredient list required. From there, the calculation gets more accurate the more information you add: if you know your recipe, you can input it; if you know where your ingredients come from, you can add that too. For anything you don't have, Carbon Maps fills the gaps using our own reference data, including consumption mixes based on global commodity distribution, and energy mixes based on reference data for your region. The result is a system where you can start with almost nothing and build precision over time, rather than waiting until you have everything before you begin.
Basic:
Intermediate:
Advanced:
Precise:
You can technically calculate a PCF in a spreadsheet. But in practice, it's extremely time-consuming, error-prone, and hard to update. More importantly, a manual spreadsheet won't be accepted as a verifiable PCF by most large customers or regulators.
Here's an honest breakdown of your options:
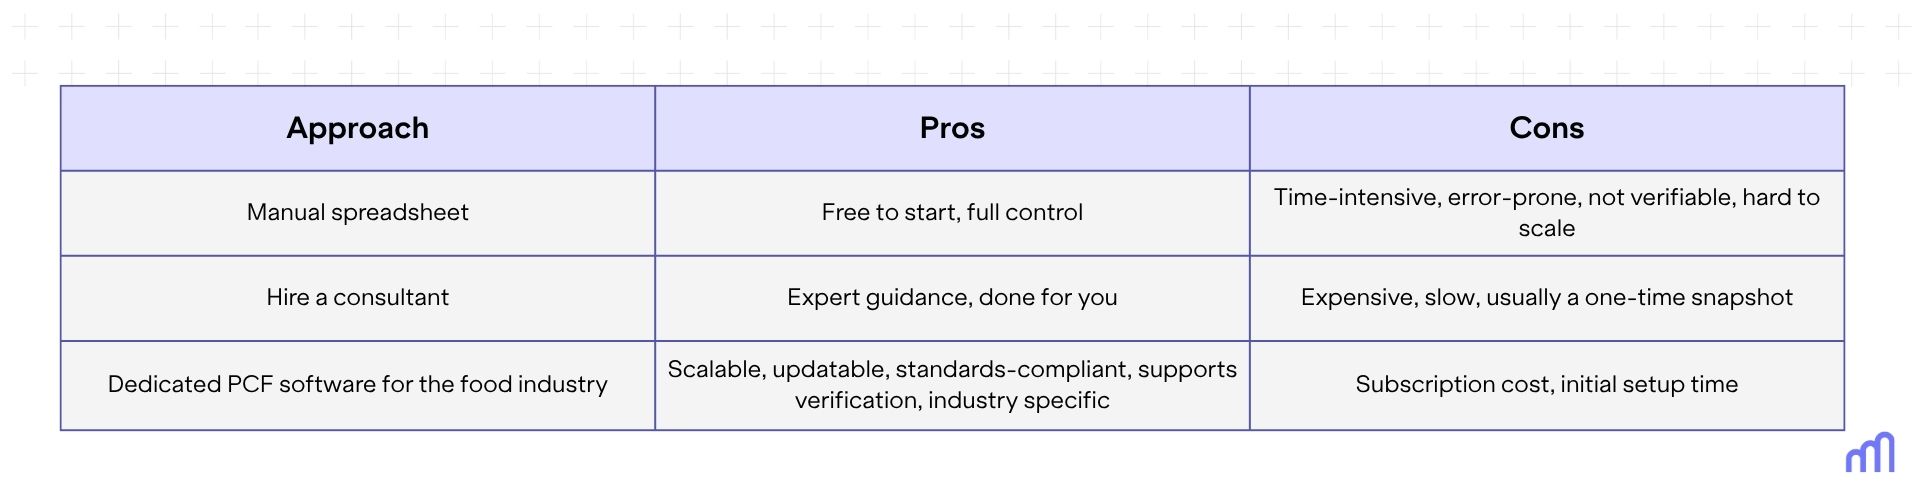
For most food companies beyond the very early stage, dedicated software is the right answer. The question then is: what should you look for in a food-specific PCF tool?
Generic carbon accounting tools often fall short for food because they don't have the agricultural emission factors needed to accurately account for what happens at the farm. A tool built specifically for food will save you a significant amount of time and produce much more accurate results.
Carbon Maps is one of the few platforms built exclusively for the food industry, covering the full range of food company types- producers, brands, retailers, and food service. We handle auditable PCF and LCA calculations at scale, with agricultural emission databases built in, a supplier engagement module for collecting primary data directly from your ingredient suppliers, and features like eco-design (to model recipe changes before committing to them) and sustainability claims support. We also cover SBTi FLAG reporting, which is increasingly relevant for food companies with significant agricultural emissions in their value chain. For food companies that need to go beyond a single product calculation and build a scalable, verifiable process across their entire portfolio, Carbon Maps is purpose-built for exactly that challenge.
This is the part that makes the effort worth it. A PCF isn't just a number you file away. It's a tool you can use in several practical ways.
Labels like Eco-Score, Planet-Score, and coût environmental are increasingly appearing on food packaging in European markets. These labels require PCF data. If you have a genuinely low-carbon product, a label lets you communicate that credibly to consumers.
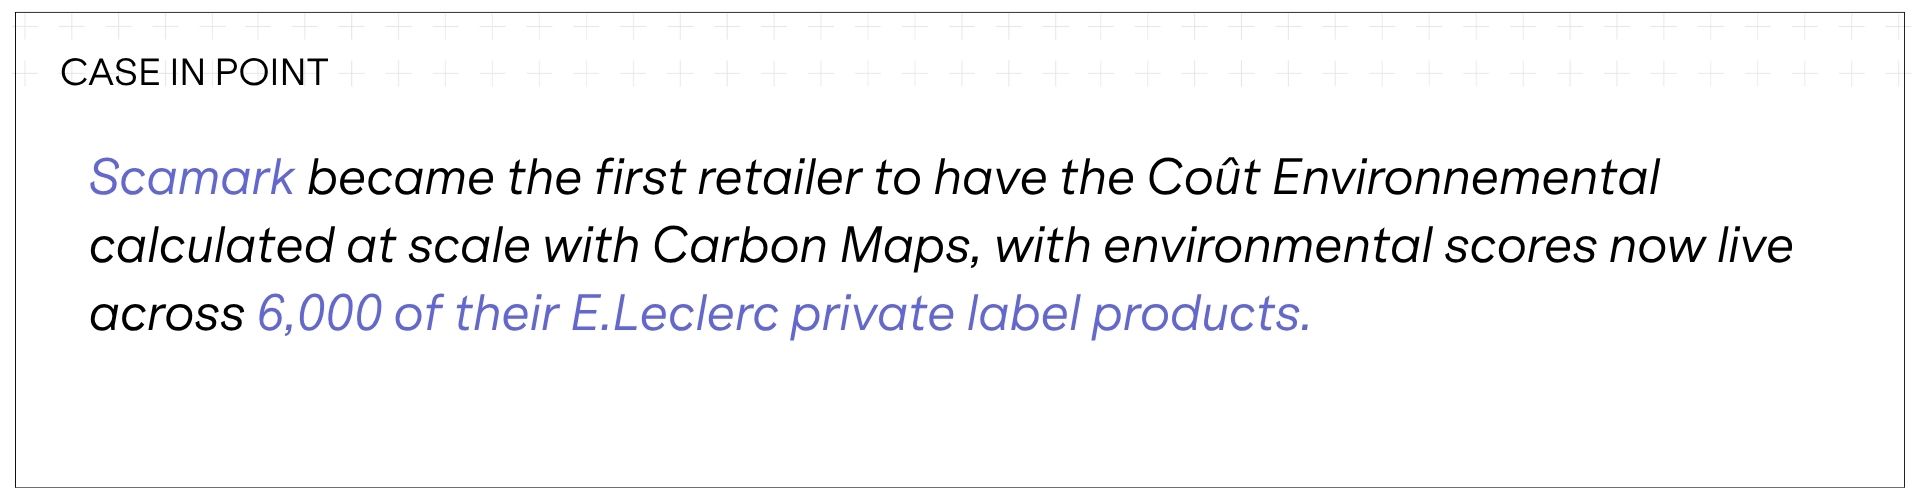
See how we helped Scamark put carbon scores on 6,000 E.Leclerc products →
Once you can see which ingredients or processes are responsible for most of your emissions, you can do something about them. This might mean working with a specific supplier to improve their farming practices, reformulating a recipe to reduce a high-carbon ingredient, or switching to a lower-carbon packaging material.
.jpg)
See how Foodles used emissions data to prioritise which recipes to rework →
As the EU Green Claims Directive and CSRD come into force, having accurate, verified PCF data means you're already prepared rather than scrambling to catch up.
.jpg)
See how Solinest automated their supplier assessments to meet CSRD →
Once you have a baseline PCF for a product, you can track it year on year. If you switch to a more sustainable supplier or reformulate a recipe, you can measure the actual impact of that decision.
.jpg)
See how Coopérative U got live Scope 3 visibility across 200,000 SKUs →
Learning from others' mistakes saves you time and protects your reputation. Here are the most common ones:
You don't need to become an expert in carbon accounting standards, but you do need to know which ones matter, because your customers and regulators will ask.
There are a few different methodologies for carrying out Product Carbon Footprints:
The good news: you don't need to choose between these yourself. A good PCF tool like Carbon Maps will handle standards alignment for you, you just need to know which standards your customers are asking for so you can confirm your tool supports them. Carbon Maps is compliant with ISO 14067, conforms with the PACT Methodology, and follows LCA methodology in line with ISO 14040 and 14044, so whichever standard your customer asks for, you're covered.
Use this as your step-by-step action plan. You don't need to complete everything before you start, tick off what you can and move forward.
☐ Identify which product to calculate first (highest volume or most urgent customer request)
☐ Decide your system boundary (cradle-to-gate is the right starting point for most)
☐ Pull together your full ingredient list with weights per unit
☐ Note the country or region of origin for your top ingredients
☐ Collect your packaging materials and weights
☐ Pull your annual facility energy data from your energy bills
☐ Choose a PCF tool or approach that's built for food (not a generic carbon tool)
☐ Run your first calculation, even if some data is estimated
☐ Review your hotspots: which 2–3 ingredients drive most of your emissions?
☐ Get third-party verification before making any public claims
☐ Schedule an annual review, set a date in your calendar now
With the right tool and data ready, a first PCF can be produced in a few days to a few weeks. At Carbon Maps, we calculate thousands of Product Carbon Footprints in a matter of minutes. The main time investment is collecting ingredient data and energy figures. If you're doing it manually or relying on a consultant, expect several weeks to months.
Costs vary significantly. A consultant engagement can cost anywhere from £5,000 to £30,000+ per product. Dedicated software typically operates on an annual subscription model, which works out much cheaper per product at scale.
Agriculture, specifically the farming of key ingredients. In most food products, 50–80% of the total carbon footprint comes from the farm, not the factory. For products containing beef, dairy, or ingredients linked to deforestation (palm oil, soy, cocoa), the agricultural share is even higher.
Not necessarily for internal use or informal customer reporting. But if you want to make any public claim about your product's environmental performance, on packaging, in marketing, or on your website, third-party verification is essential. Without it, you're exposed to greenwashing accusations and regulatory risk under the EU Green Claims Directive.
A Product Carbon Footprint only measures greenhouse gas emissions. A Life Cycle Assessment (LCA) is broader, it also covers water use, land use, biodiversity impact, and other environmental factors. A PCF is a good starting point; an LCA gives a more complete picture but is more time-consuming and expensive to produce.
Read more about the difference between the two in our article→
The mandatory requirements are evolving quickly. Large companies operating in the EU are already subject to CSRD reporting requirements. The EU Green Claims Directive will require verified data behind any environmental claim, regardless of company size. If you supply to large food brands or retailers, their own compliance requirements will increasingly be passed down to suppliers through procurement contracts.
Yes, one PCF calculation can be shared with multiple customers. The key is that the calculation is done to a recognised standard (typically ISO 14067) and that you're transparent about the methodology and data sources used.
Ready to calculate your first Product Carbon Footprint? Book a demo.