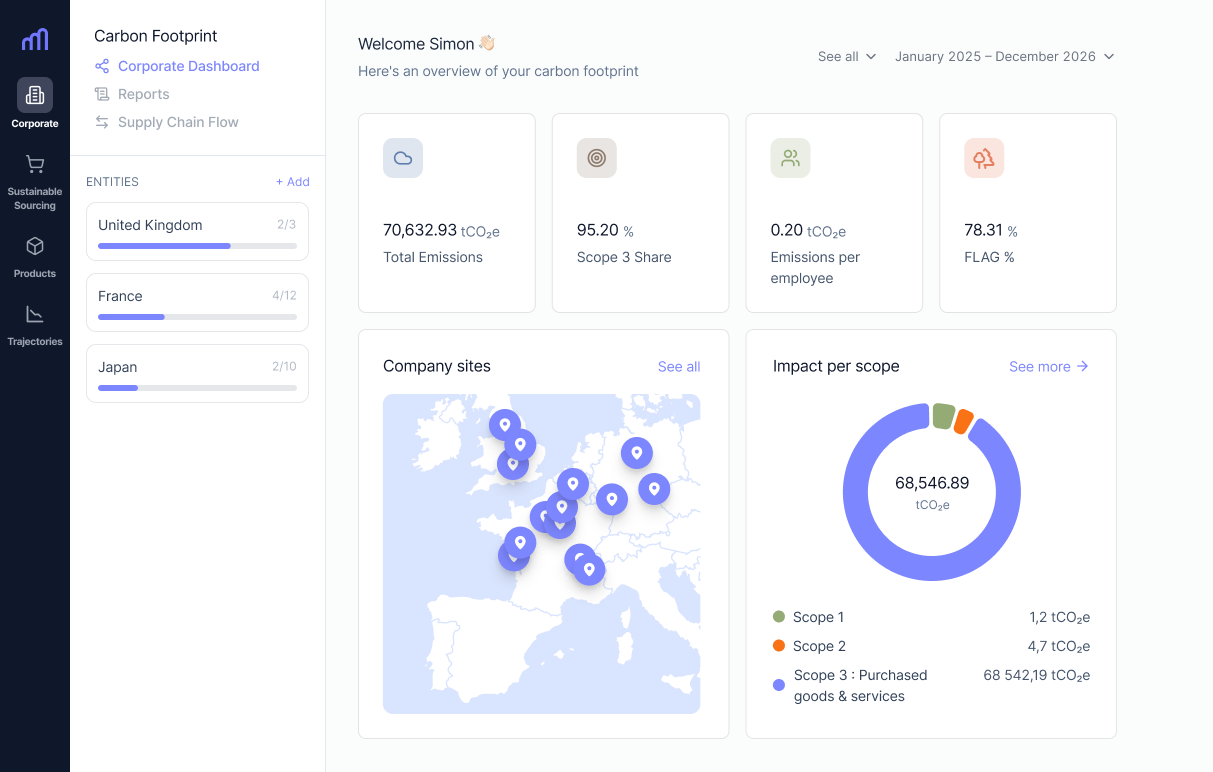
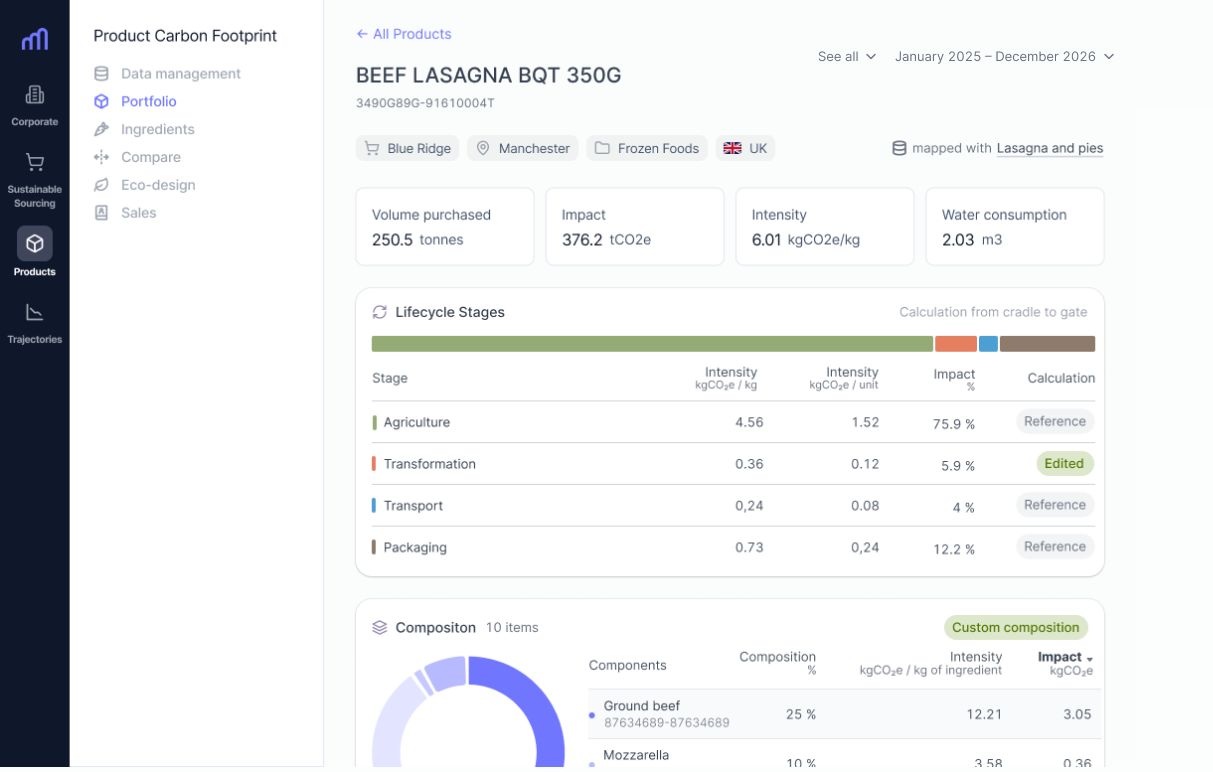
Every update,
reflected across
your entire portfolio.
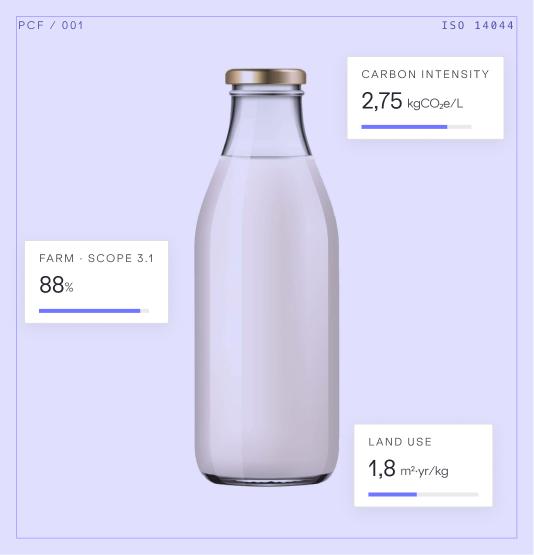
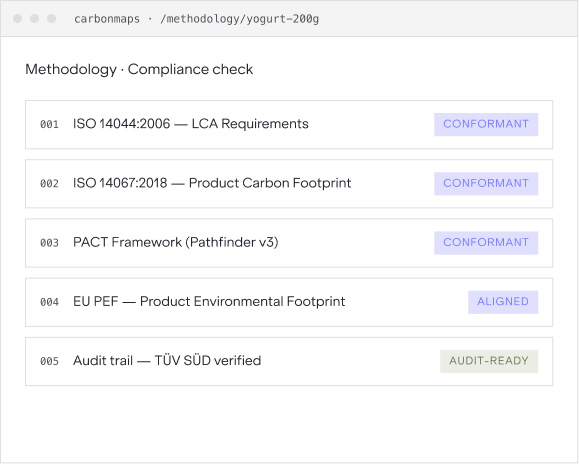
Carbon Maps PCFs are fully aligned with ISO 14044, PACT
and PEF methodologies — the frameworks your customers,
retailers, and suppliers are converging on. Every calculation
is audit-ready and comparable, so your disclosures hold up
to scrutiny wherever they land.

ISO 14040 / 14044 / 14067
EU PEF methodology
Third-party auditable trails