
France has been building toward standardized environmental labeling for years. It started with textile where the affichage environnemental framework gave fashion brands a standardized way to display the environmental impact of clothing and accessories, launched in October 2025. Now, the same ambition is expanding to food.
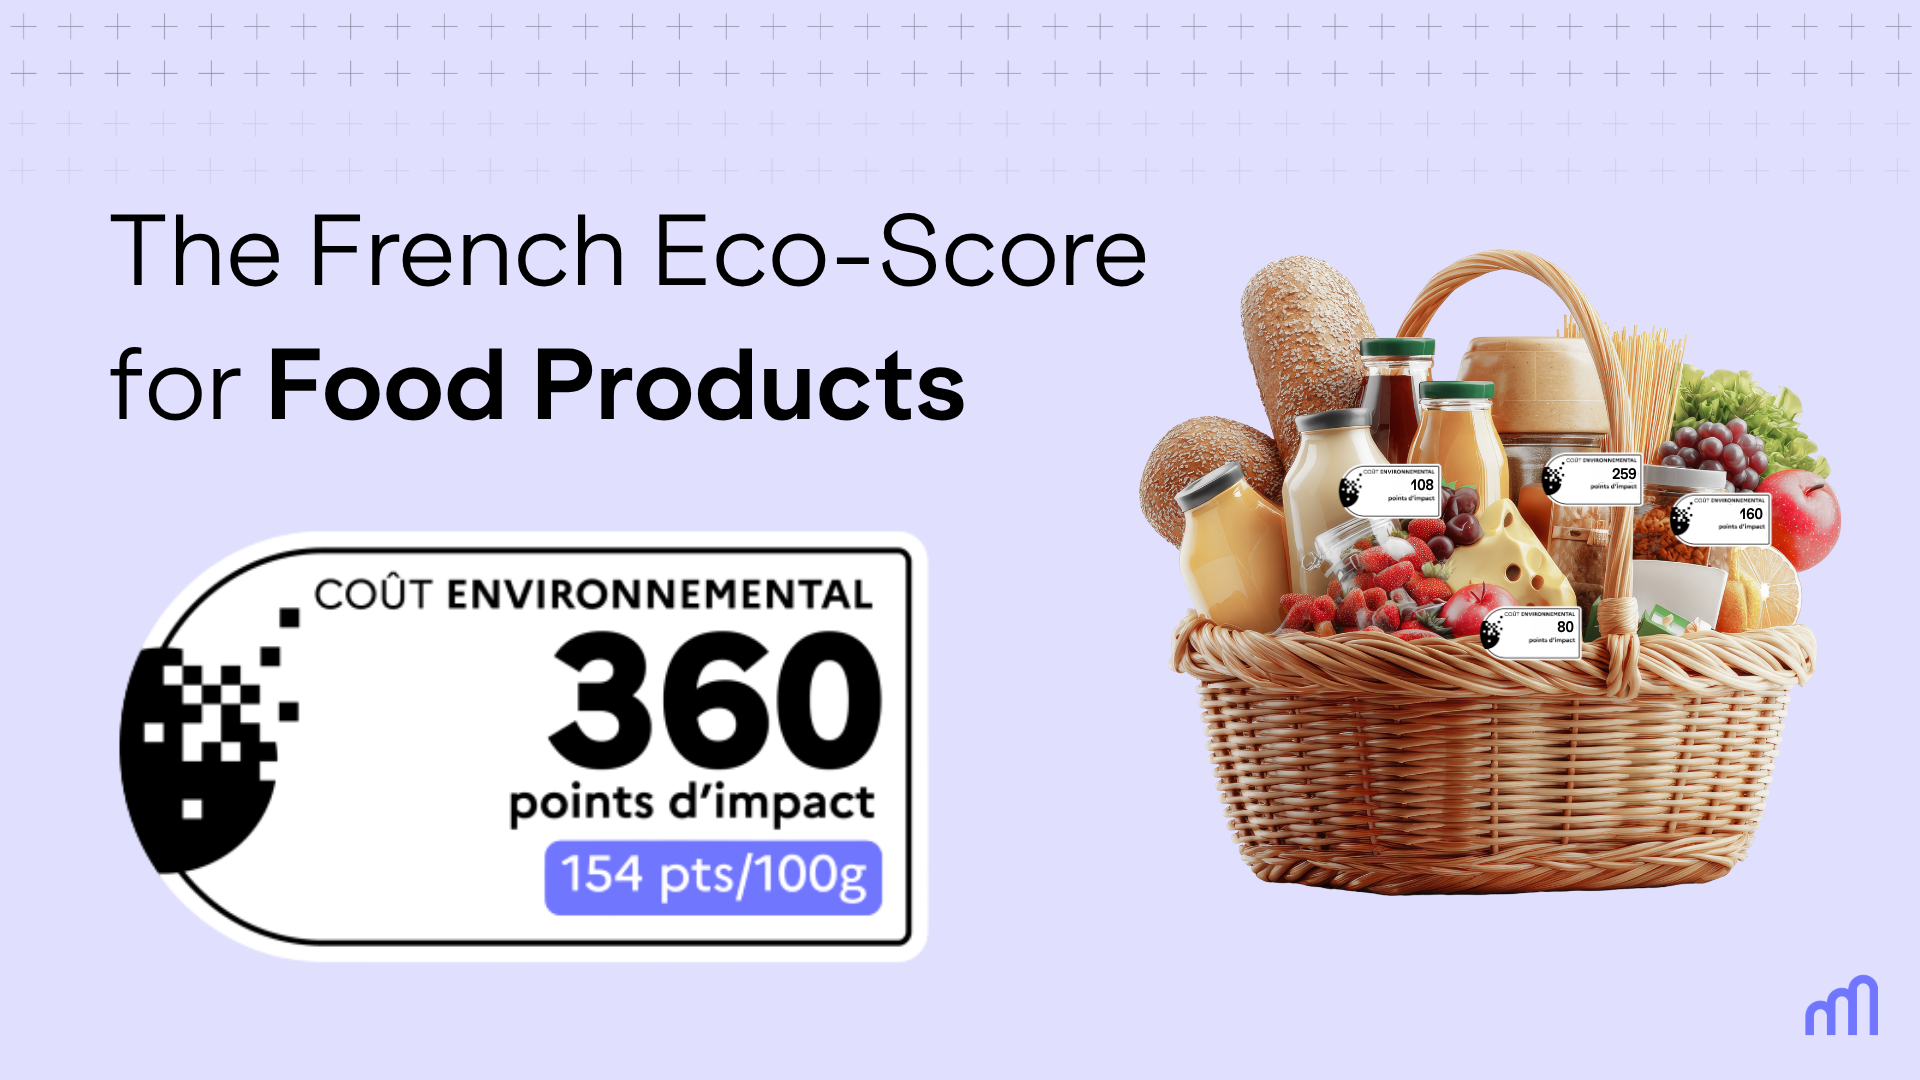
At the heart of this expansion is the eco-score for food, a composite score that captures the full environmental footprint of a food product, from the field where its ingredients are grown to its consumption stage. Developed by the French Ministry of Ecological Transition and calculated via the open-source Ecobalyse platform, it is set to become the standard environmental indicator for food products sold in France.
And the demand is there: according to E.Leclerc's Observatory of New Consumer Trends, nearly 8 out of 10 French consumers say they would consult an environmental indicator to guide their food purchases, yet 38% cite a lack of information on the ecological impact of products as a barrier to more sustainable choices.
For food manufacturers, retailers, and cooperatives, this is not a distant regulatory horizon. The framework is live, the methodology is published, and Carbon Maps is the first platform to implement it at scale having already deployed it across 6,000+ private label products of E. Leclerc, France's leading grocery retailer. The question is no longer whether to implement it, it's how.
When most people think about the environmental impact of food, they think about carbon. Greenhouse gas emissions (CO2e) matter but they tell only part of the story. A product with a low carbon footprint can still drive biodiversity loss, deplete freshwater resources, or contribute to soil acidification. Carbon alone is not enough.
The eco-score for food is built on a different premise: that the full environmental footprint of a food product can only be understood by looking across multiple impact categories simultaneously. The score aggregates 16 indicators drawn from the European Product Environmental Footprint (PEF) methodology, organized into four dimensions:

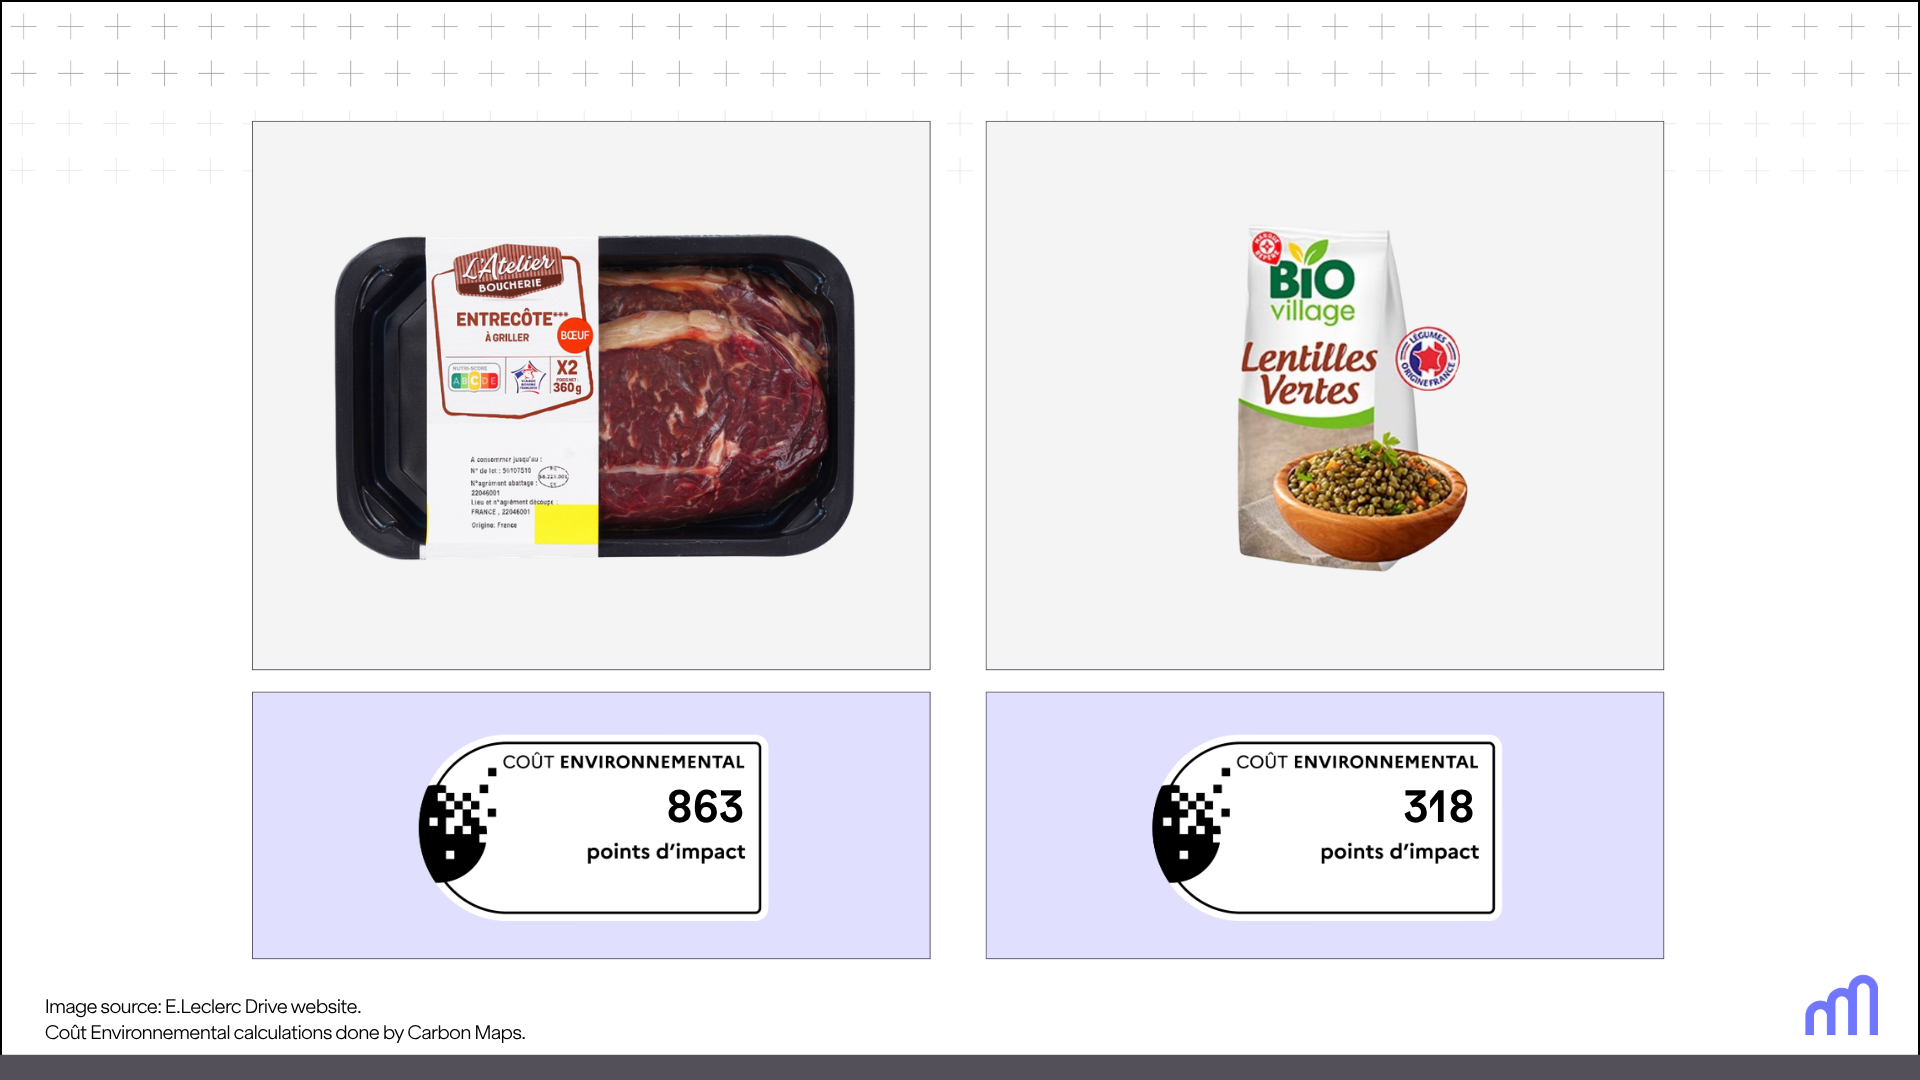
Each indicator is normalized and weighted to produce a single composite score, expressed in impact points. Think of it this way: the total annual environmental impact of one European inhabitant equals one megapoint (MPt). Every food product is then scored as a fraction of that reference. A 100g serving of beef, for instance, carries a much larger share of that budget than a 100g serving of lentils and the eco-score makes that difference visible in a single number.
This multi-criteria approach is what makes the methodologically for the eco-score robust and what makes it significantly more demanding to calculate than a standalone carbon footprint.
In addition to the 16 indicators, four additional criteria also capture ecosystem services that standard LCA doesn't yet cover: hedgerow presence, permanent grasslands, plot diversity, and plot size. If you've invested in regenerative agriculture or responsible land management, this is where those practices show up.
The eco-score for food is built on Life Cycle Assessment (LCA), a methodology that quantifies the environmental impacts of a product across its entire value chain. For the eco-score for food, the scope runs from farm to consumption: where ingredients come from, how they are processed, how the product is packaged, transported, and ultimately consumed. End-of-life impacts (such as packaging waste) are not yet fully integrated into the current methodology.
The starting point is the European PEF framework, which Ecobalyse adapts with a set of adjustments specific to the French state's environmental labeling methodology:

Something very important to know about the eco-score for food is that it is not calculated at the product level alone. It is built up stage by stage, from the origin of each ingredient to the moment the product is consumed. There are five stages in total.
This is where the largest share of a food product's environmental impact is typically determined. For each ingredient, the model draws on Life Cycle Inventory (LCI) data from Agribalyse, France's national LCA database for food, managed by ADEME in partnership with INRAE and a network of agricultural research institutes. Agribalyse covers more than 2,500 food products consumed in France and is continuously updated to reflect the latest scientific advances—including through contributions from specialized platforms: Carbon Maps, for instance, responded to Ecobalyse's open call for contributions by modeling several hundred food ingredients across multiple origin variants, now accessible to all users of the tool.
The origin of each ingredient matters significantly. The model distinguishes between French production, EU production, non-EU production, unknown origin, and organic production — each mapped to a different inventory.
Where an ingredient's origin is unknown, a conservative approach is applied: the model selects the inventory with the highest environmental impact among available candidates. This selection is further cross-referenced against FAO export data to ensure the chosen inventory represents a meaningful share of actual global trade for that ingredient, avoiding any risk of underestimation while remaining grounded in real-world sourcing patterns.
The final score can also be adjusted to reflect the sustainability of the agricultural practices used; rewarding, for example, farming methods that preserve biodiversity or reduce chemical inputs.
The processing stage models the transformation applied to ingredients before the final product is assembled: cooking, canning, mixing. It is important to note that only the last non-specific transformation is modeled at this stage — specific processes such as winemaking, cheese affinage, or meat cutting are considered already embedded in the ingredient inventory and are therefore not modeled separately here.
For example, the transformation of milk into mozzarella cannot be modeled at the processing stage. Instead, the impact of mozzarella is calculated by selecting it directly as an ingredient.
Packaging is modeled based on material type and mass. The methodology draws on the PACK AGB project, co-funded by ADEME, which has produced standardized environmental impact data for the packaging formats most commonly used in the French food industry.
The distribution stage covers storage and retail. In practice, the environmental impact of the warehousing stage is considered negligible, and is not modeled in the current methodology. The retail stage accounts for the store's energy consumption — both electricity and heat — as well as its water consumption.
The final stage accounts for the energy used to prepare and store the product at home: refrigeration, freezing, cooking by oven, microwave, or hob. This stage is optional and product-dependent. For example: an apple requires no preparation energy; a frozen meal requires both freezer storage and oven or microwave cooking.
Together, these five stages give the eco-score for food its farm-to-consumption scope and make clear why ingredient-level data is what separates a meaningful score from a rough approximation.
Transport is not a standalone stage but a transversal element that runs across all five stages of the calculation for the eco-score for food. Several legs are accounted for: from the farm to the processing site, from the processing site to the warehouse, and from the warehouse to the point of sale. For imported ingredients, the international transport leg (from the country of origin to France) is also modeled, including the mode of transport.
Three transport modes are considered: road, sea, and air. The split between them depends on the origin of the ingredient and the distances involved.
Default distance assumptions are applied when specific origin data is not available. These defaults are deliberately set on the higher end, erring on the side of overestimating impact rather than underestimating it. When the country of origin of an ingredient is known, it can be specified to produce a more accurate transport impact.
Implementing the eco-score for food across a large product portfolio is not only a labeling exercise but a data infrastructure challenge. Every product requires ingredient-level detail: origins, processing, packaging, transport. For a retailer or manufacturer with thousands of SKUs, that means handling that granularity at scale, across dynamic supply chains.
Carbon Maps was built for exactly this. As a platform purpose-built for the food industry, it models environmental impact at the ingredient and agricultural practice level, which is the same level of granularity the eco-score for food requires. Its activity-based approach to Scope 3 emissions means that supply chain data is already structured in a way that maps directly onto the Ecobalyse methodology: ingredient origins, processing steps, transport assumptions, and packaging materials are all modeled as discrete, updatable inputs rather than static estimates.
Carbon Maps has directly contributed to the framework, providing its proprietary ingredient dataset—covering more than 2,000 ingredients across five origin variants—to the Ecobalyse platform. The result is methodological alignment at the calculation level: scores produced on Carbon Maps are fully consistent with those produced on Ecobalyse.
This is what made it possible to deploy the eco-score for food at scale for E. Leclerc, France's leading grocery retailer. Working with Scamark, E. Leclerc's private label arm, Carbon Maps calculated the eco-score across more than 6,000 food products, making it the largest deployment of the methodology to date, and the first proof that it can be implemented across an entire retail portfolio rather than a handful of pilot products.
For food manufacturers, retailers, and cooperatives now looking to implement the eco-score for food, the Scamark, E. Leclerc deployment sets both a precedent and a benchmark. The methodology is not theoretical. The infrastructure exists. And the path from product portfolio to published environmental scores is shorter than it might appear, provided the underlying data is structured correctly.
Carbon Maps is already working with leading food manufacturers and retailers to deploy the eco-score for food at scale. If you want to understand what implementation would look like for your portfolio, book a call with our team.