Automated Corporate and Product-level assessments powered by AI, built for food brands, manufacturers, and retailers to tackle Scope 3 emissions cost-efficiently.


Save time & resources
Generate PCFs and LCAs across thousands of SKUs in days instead of months.
Your sustainability, R&D, and procurement teams free up time to focus on strategy and carbon reduction — not manual data crunching.
Ensure compliance & credibility
Audit-ready Corporate Carbon Footprint assessments aligned with GHG Protocol, ISO 14040, 14044 and 14067, and SBTi and EU PEF frameworks.
Meet CSRD, SBTi and other reporting obligations with confidence, eliminating regulatory risk.
Drive real carbon reduction
Identify the biggest emission hotspots at ingredient, supplier, and product level.
Gain actionable insights to reduce Scope 3 and FLAG emissions, improve supply chain collaboration, and deliver on sustainability targets.
Curb rising sustainability costs with an end-to-end platform that unifies your Corporate Carbon Footprint and Product LCAs/PCFs, and supplier engagement in one place.

→ Automate PCFs and LCAs across hundreds of thousands of SKUs in just days.
→ Run real-time, on-demand analyses whenever you need actionable insights.
→ Generate audit-ready assessments even with data gaps—leveraging 0% to 100% primary data.
→ Stay ahead with expert-backed methodology aligned with GHG Protocol, ISO 14040, 14044 and 14067, and EU PEF standards.
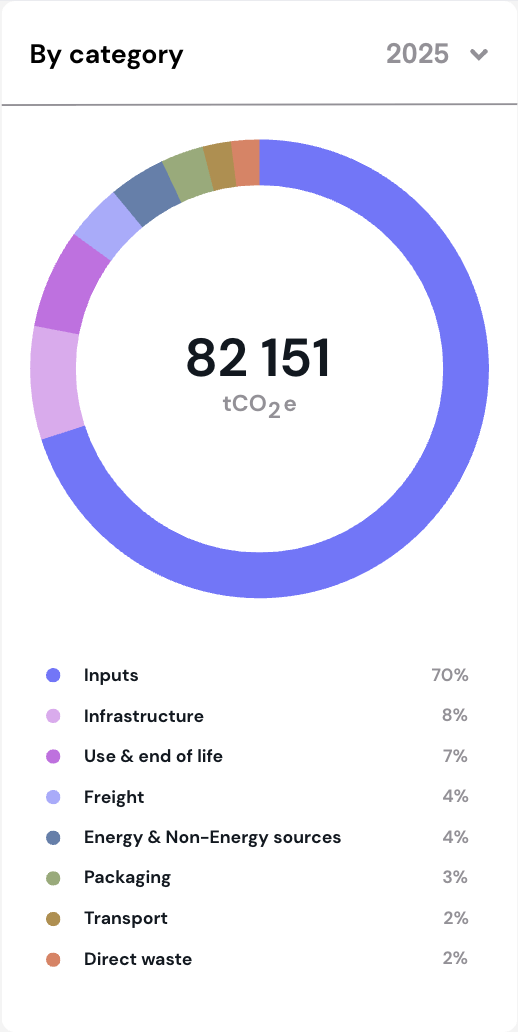
Automatically measure, build reduction trajectories and report your Scope 1, 2 and 3 emissions.
Scope 1, 2 and 3
Scope 3.1 expertise: robust modeling of upstream ingredients and suppliers
Aligned with GHG Corporate Standard, SBTi framework, and CSRD reporting rules
FLAG and Non-FLAG split down to the ingredient-level
Generate PCFs and LCAs at scale for food and non-food products.
Multi-level hotspot analysis
Go as deep as ingredient-level and packaging material-level assessments
Aligned with GHG Product Carbon Footprint Standard, ISO 14040, 14044 and 14067
Product and portfolio eco-design and benchmarking
Easily incentivize your suppliers to share primary data and validate it to strengthen your entire footprint.
Automated supplier data collection and development of specific emission factors based on supplier inputs
Supplier PCF/LCA validation
Supplier ESG assessment and rating
A centralized repository for all supplier data aggregated in a single connected platform


Answers to the most common questions about Carbon Maps’ approach.
Carbon Maps delivers the precision of consultant-led LCAs, but at the speed and scale only software can provide. Instead of waiting months for static reports, you can run automated, auditable assessments across hundreds or thousands of products in days. Unlike generic calculators, our platform combines ingredient-level granularity with enterprise scalability—built specifically for the food and beverage industry.
We go deeper where it matters most: Scope 3.1 (Purchased Goods & Services)—often the largest share of emissions for food- and agriculture-linked companies. Carbon Maps ties ingredient- and product-level data to your corporate inventory, so your footprint reflects real operations, not broad averages. This way, you get a more accurate, defensible corporate footprint—and a clear roadmap to reduce it.
Yes. Carbon Maps is designed to work with whatever data you have today—whether 0% or 100% primary supplier data. Our AI-driven engine matches your information with the most relevant emission factors from a database of 34,000+, filling gaps and modeling complex supply chains. As you collect more primary data, your results become even more precise.
Absolutely. Every assessment generated with Carbon Maps follows international standards such as the GHG Protocol, ISO 14040, 14044, 14067, and the EU Product Environmental Footprint (PEF). This means your outputs are audit-ready, trusted by regulators, and aligned with reporting frameworks like CSRD and SBTi—so you can move forward with confidence.

