How Carbon Maps Helps Coopérative U Turn Scope 3 Insight into Daily Action
Coopérative U moved from spreadsheets to a live, product-level view of Scope 3 across 200k SKUs. With Carbon Maps, teams see hotspots by category and supplier, trust the data, and use it in daily buying.
What’s New in the SBTi Net-Zero Standard V2: November 2025 Update Explained
Read about the biggest updates to the SBTi Corporate Net-Zero Standards V2 November 2025 draft: Scope 1-3 target setting, the replacement of BVCM, and stronger rules for assessment, assurance and claims.
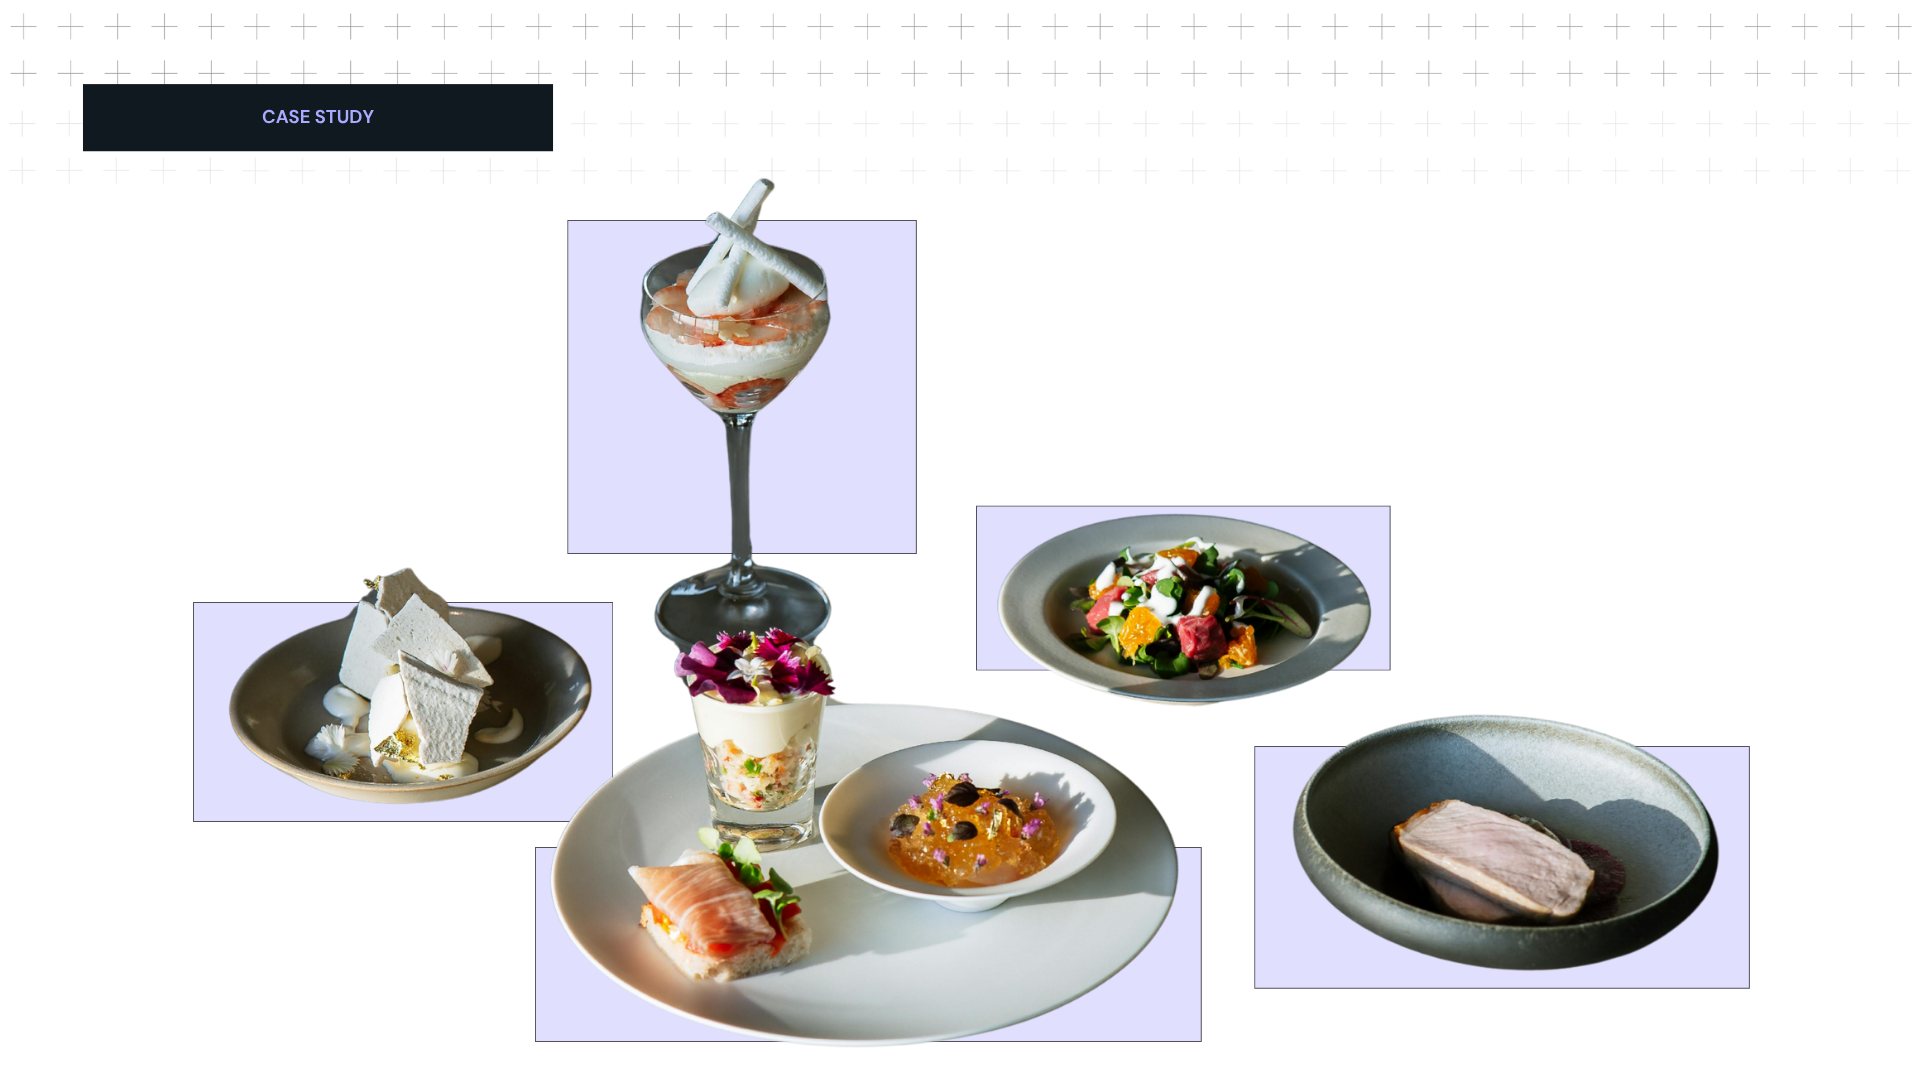
How a Luxury Hotel Uses Carbon Maps to Measure the Environmental Impact of its Procurement
How a renowned luxury hotel used Carbon Maps to transform thousands of supplier PDFs into a comprehensive carbon footprint, taking the first measurable step toward a more sustainable approach to modern luxury dining.


.webp)